1,274
Views
19
CrossRef citations to date
0
Altmetric
Research Article

Nantenine as an acetylcholinesterase inhibitor: SAR, enzyme kinetics and molecular modeling investigations

, &
Pages 46-55 | Received 04 Nov 2009, Accepted 12 Jan 2010, Published online: 28 Jun 2010

Figures & data

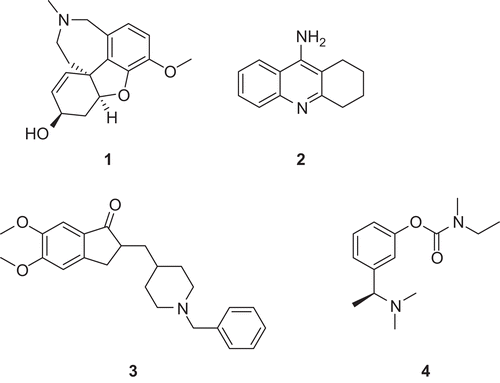
Figure 1. Clinically available AChE inhibitors.

Figure 1.  Clinically available AChE inhibitors.

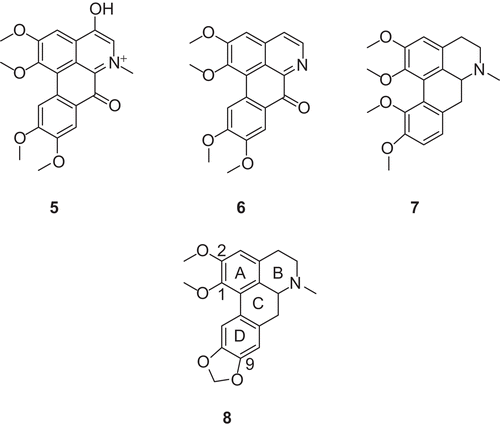
Figure 2. Structures of known aporphinoid AChE inhibitors (5, 6 and 7) and nantenine (8).

Figure 2.  Structures of known aporphinoid AChE inhibitors (5, 6 and 7) and nantenine (8).

Scheme 1. Synthesis of target analogs 15a-15b. Reagents and conditions: (a) Pd(PPh3)4, DME, K2CO3, reflux, 24h; (b) CH3NO2, NH4OAc, reflux, 4h; (c) LiBH4, TMSCI, THF, reflux; (d) HCOOEt, Et3N, DCM for 14a; (e) acetyl chloride, Et3N, DCM for 14b; (f) POCl3, MeCN, 50°C, 12h; (g) NaBH4, MeOH, 0°C, 4h; (h) HCNO, NaBH(OAc)3, DCM, rt, 24h.
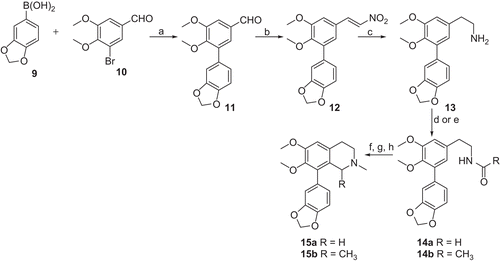
Scheme 1.  Synthesis of target analogs 15a-15b. Reagents and conditions: (a) Pd(PPh3)4, DME, K2CO3, reflux, 24h; (b) CH3NO2, NH4OAc, reflux, 4h; (c) LiBH4, TMSCI, THF, reflux; (d) HCOOEt, Et3N, DCM for 14a; (e) acetyl chloride, Et3N, DCM for 14b; (f) POCl3, MeCN, 50°C, 12h; (g) NaBH4, MeOH, 0°C, 4h; (h) HCNO, NaBH(OAc)3, DCM, rt, 24h.

Figure 3. Other seco-ring C nantenine analogs.

Figure 3.  Other seco-ring C nantenine analogs.

Table 1. AChE inhibitory activity of analogues.

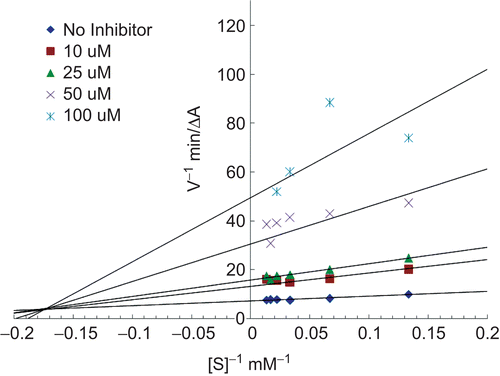
Figure 4. Lineweaver-Burk steady-state inhibition plot showing mixed inhibition for nantenine.

Figure 4.  Lineweaver-Burk steady-state inhibition plot showing mixed inhibition for nantenine.

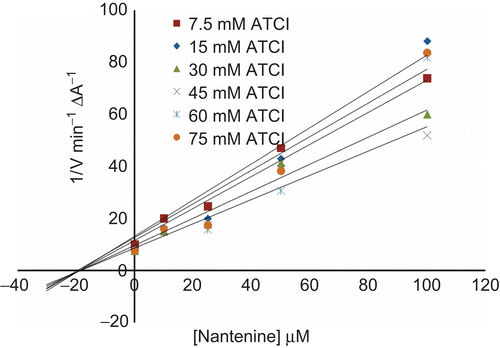
Figure 5. Dixon plot. (Intercept on the x- axis is -Ki).

Figure 5.  Dixon plot. (Intercept on the x- axis is -Ki).

Table 2. ICM docking scores for nantenine (8) and galanthamine (1) in AChE.

Figure 6. A is an ICM model of nantenine in the catalytic site of AChE. Pose shown is for lowest energy conformation (pose number 1 in ) and B the LigPlot model of nantenine in the catalytic site of AChE.
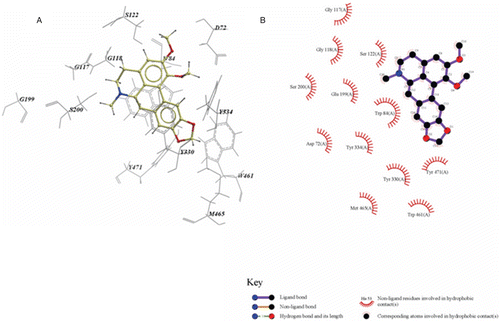
Figure 6.  A is an ICM model of nantenine in the catalytic site of AChE. Pose shown is for lowest energy conformation (pose number 1 in Table 2) and B the LigPlot model of nantenine in the catalytic site of AChE.

Figure 7. A is an ICM model of nantenine in the PAS of AChE. Pose shown is for the lowest energy conformation in the PAS (pose number 4 in ) and B is the LigPlot model of Nantenine in the PAS.
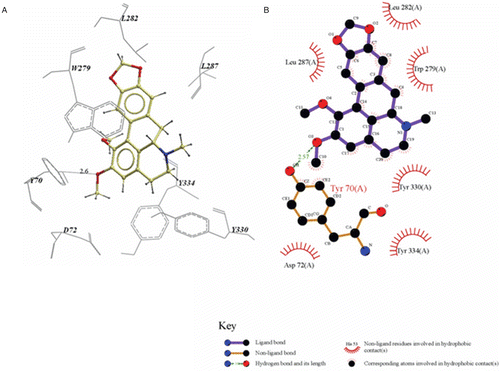
Figure 7.  A is an ICM model of nantenine in the PAS of AChE. Pose shown is for the lowest energy conformation in the PAS (pose number 4 in Table 2) and B is the LigPlot model of Nantenine in the PAS.

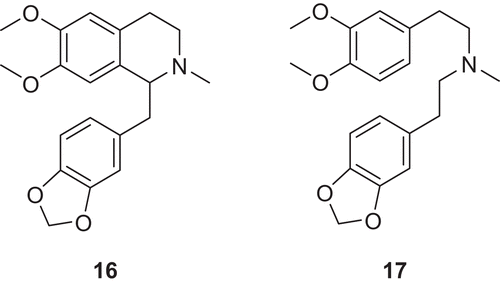
Table 3. ICM predicted binding sites for 15a, 16 and 17.
Reprints and Corporate Permissions

Please note: Selecting permissions does not provide access to the full text of the article, please see our help page How do I view content?

To request a reprint or corporate permissions for this article, please click on the relevant link below:

Academic Permissions

Please note: Selecting permissions does not provide access to the full text of the article, please see our help page How do I view content?

Obtain permissions instantly via Rightslink by clicking on the button below:

If you are unable to obtain permissions via Rightslink, please complete and submit this Permissions form. For more information, please visit our Permissions help page.