898
Views
6
CrossRef citations to date
0
Altmetric
Research Article

Structural analysis of structurally diverse α-glucosidase inhibitors for active site feature analysis

, &
Pages 649-657 | Received 16 Jun 2011, Accepted 12 Jul 2011, Published online: 08 Sep 2011

Figures & data

Table 1.  Summary of the validation results.

Figure 1.  Scatterplot between observed activity and predicted activites (LSO, LOO, LMO, bootstraping and normal) of model 1.
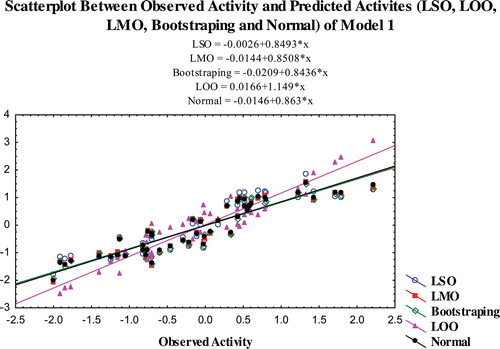
Figure 1.  Scatterplot between observed activity and predicted activites (LSO, LOO, LMO, bootstraping and normal) of model 1.

Figure 2.  Scatterplot between observed activity and predicted activites (LSO, LMO, LOO, bootstraping, normal) of model 2.
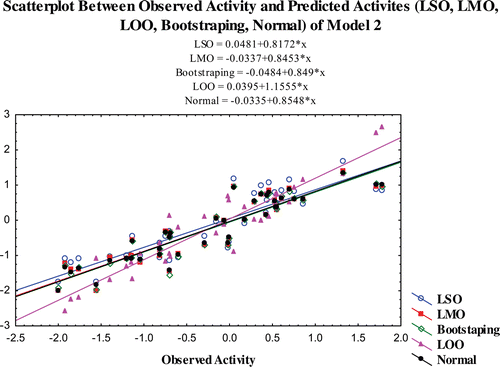
Figure 2.  Scatterplot between observed activity and predicted activites (LSO, LMO, LOO, bootstraping, normal) of model 2.

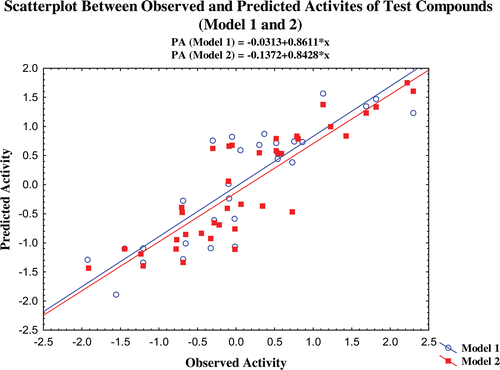
Figure 3.  Scatterplot between observed and predicted activites of test compounds (model 1 and 2).

Figure 3.  Scatterplot between observed and predicted activites of test compounds (model 1 and 2).

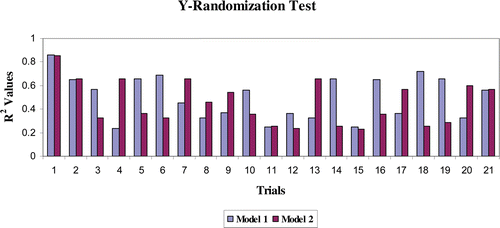
Figure 4.  Y-randomization test.

Figure 4.  Y-randomization test.

Table 2.  VIF and Durban–Watson values for the models.
Supplemental material

Supplementary Material

Download PDF (1,020.5 KB)

Reprints and Corporate Permissions

Please note: Selecting permissions does not provide access to the full text of the article, please see our help page How do I view content?

To request a reprint or corporate permissions for this article, please click on the relevant link below:

Academic Permissions

Please note: Selecting permissions does not provide access to the full text of the article, please see our help page How do I view content?

Obtain permissions instantly via Rightslink by clicking on the button below:

If you are unable to obtain permissions via Rightslink, please complete and submit this Permissions form. For more information, please visit our Permissions help page.