1,632
Views
22
CrossRef citations to date
0
Altmetric
Research Article

Inhibition of cysteine proteases by a natural biflavone: behavioral evaluation of fukugetin as papain and cruzain inhibitor

, , , , , , , , , , , & show all
Pages 661-670 | Received 24 Nov 2011, Accepted 13 Feb 2012, Published online: 02 Apr 2012

Figures & data

Figure 1.  Structure of fukugetin. IUPAC name: 8-[(2S,3R)-5,7-dihydroxy-2-(4-hydroxyphenyl)-4-oxo-2, 3-dihydrochromen-3-yl]-2-(3,4-dihydroxyphenyl)-5,7-dihydroxychromen-4-one.

Figure 1.  Structure of fukugetin. IUPAC name: 8-[(2S,3R)-5,7-dihydroxy-2-(4-hydroxyphenyl)-4-oxo-2, 3-dihydrochromen-3-yl]-2-(3,4-dihydroxyphenyl)-5,7-dihydroxychromen-4-one.

Table 1.  Crystal data and structure refinement for fukugetin.

Figure 2.  ORTEP view of fukugetin (S-enantiomers) showing the arbitrary atom labelling. Ellipsoids represent 50% probability level.
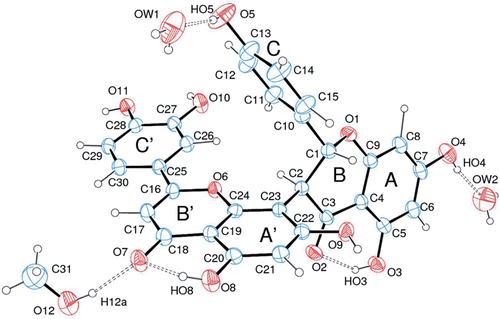
Figure 2.  ORTEP view of fukugetin (S-enantiomers) showing the arbitrary atom labelling. Ellipsoids represent 50% probability level.

Figure 3.  Slow-binding inhibition of papain (upper) and cruzain (lower) by fukugetin. Left− time course of inactivation. Right− first-order constant (Kobs) as function of inhibitor concentration.
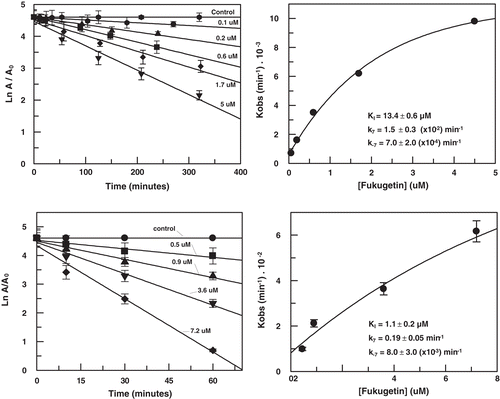
Figure 3.  Slow-binding inhibition of papain (upper) and cruzain (lower) by fukugetin. Left− time course of inactivation. Right− first-order constant (Kobs) as function of inhibitor concentration.

Scheme 1.  Reversible slow-binding enzyme inhibition.

Scheme 1.  Reversible slow-binding enzyme inhibition.

Table 2.  Kinetic parameters from papain and cruzain inhibition by fukugetin (means ± standard deviation).

Figure 4.  (A) Lineweaver–Burk plot for hydrolysis of Cbz-Phe-Arg-MCA by papain in the presence and absence of fukugetin and (B) the secondary plots of showing the hyperbolic inhibition type mixed on fukugetin concentration. The reaction was carried out in the absence (• ) and in the presence of fukugetin; Δ, 1.5µM; ▪, 3µM; ◊, 6µM and ◆, 12µM.
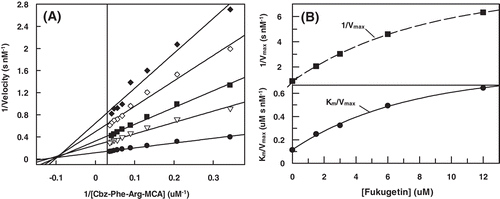
Figure 4.  (A) Lineweaver–Burk plot for hydrolysis of Cbz-Phe-Arg-MCA by papain in the presence and absence of fukugetin and (B) the secondary plots of showing the hyperbolic inhibition type mixed on fukugetin concentration. The reaction was carried out in the absence (• ) and in the presence of fukugetin; Δ, 1.5µM; ▪, 3µM; ◊, 6µM and ◆, 12µM.

Figure 5.  (A) Lineweaver–Burk plot for hydrolysis of Cbz-Phe-Arg-MCA by cruzain in the presence and absence of fukugetin and (B) the secondary plots showing the dependence of the axis 1/Vmax and the Km/Vmax on the fukugetin concentration. The reaction was carried out in the absence (• ) and in the presence of fukugetin; □ 1µM; ▴, 2µM; ◊, 5µM; ◆, 10µM and ◊, 18µM.
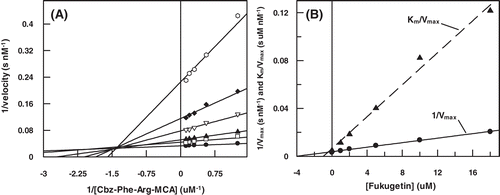
Figure 5.  (A) Lineweaver–Burk plot for hydrolysis of Cbz-Phe-Arg-MCA by cruzain in the presence and absence of fukugetin and (B) the secondary plots showing the dependence of the axis 1/Vmax and the Km/Vmax on the fukugetin concentration. The reaction was carried out in the absence (• ) and in the presence of fukugetin; □ 1µM; ▴, 2µM; ◊, 5µM; ◆, 10µM and ◊, 18µM.

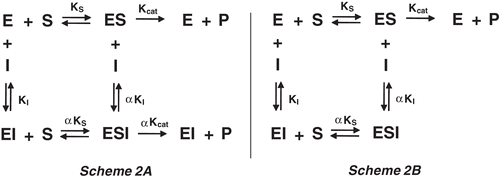
Scheme 2   Schematic mechanism of inhibition.

Scheme 2   Schematic mechanism of inhibition.

Figure 6.  Molecular docking of papain (left) and cruzain (right) fukugetin inhibitor. The proteins are represented based on electrostatic potential surface (EPS); inhibitor carbons are pink, hydrogens are white and oxygens are red. The papain and cruzain structure files were downloaded from the Protein Data Bank (PDB code 1PE6 and 1F2C, respectively).
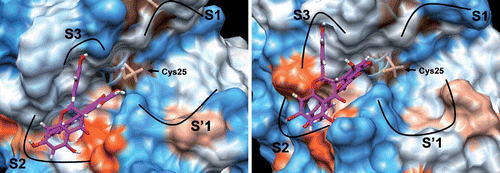
Figure 6.  Molecular docking of papain (left) and cruzain (right) fukugetin inhibitor. The proteins are represented based on electrostatic potential surface (EPS); inhibitor carbons are pink, hydrogens are white and oxygens are red. The papain and cruzain structure files were downloaded from the Protein Data Bank (PDB code 1PE6 and 1F2C, respectively).

Figure 7.  Best docking poses for fukugetin inside the subsites of cruzain (left) and papain (right). The hydrogen bonds that contribute for inhibitor anchoring are shown as yellow lines and the hydrophobics interactions as green lines. Some amino acids were highlighted due to their key roles in the binding of inhibitor. H atoms in C-H bonds are omitted.

Figure 7.  Best docking poses for fukugetin inside the subsites of cruzain (left) and papain (right). The hydrogen bonds that contribute for inhibitor anchoring are shown as yellow lines and the hydrophobics interactions as green lines. Some amino acids were highlighted due to their key roles in the binding of inhibitor. H atoms in C-H bonds are omitted.

Figure 8.  (A) Time course of enzymatic activity from Trypanosoma cruzi extract in the presence of fukugetin 10 µM and (B) enzymatic activity as function of fukugetin concentration. Both experiments were carried out using Cbz-Phe-Arg-MCA 10 µM as substrate.
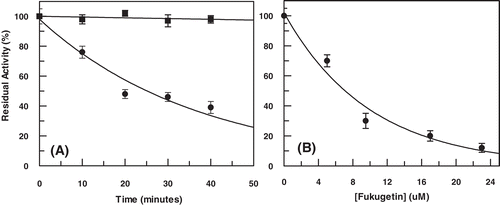
Figure 8.  (A) Time course of enzymatic activity from Trypanosoma cruzi extract in the presence of fukugetin 10 µM and (B) enzymatic activity as function of fukugetin concentration. Both experiments were carried out using Cbz-Phe-Arg-MCA 10 µM as substrate.
Reprints and Corporate Permissions

Please note: Selecting permissions does not provide access to the full text of the article, please see our help page How do I view content?

To request a reprint or corporate permissions for this article, please click on the relevant link below:

Academic Permissions

Please note: Selecting permissions does not provide access to the full text of the article, please see our help page How do I view content?

Obtain permissions instantly via Rightslink by clicking on the button below:

If you are unable to obtain permissions via Rightslink, please complete and submit this Permissions form. For more information, please visit our Permissions help page.