Figures & data
Table 1. Purification of recombinant SspCA produced in E. coli.
Figure 1. SDS-PAGE of the recombinant SspCA purified from E. coli. Lane a, molecular markers, M.W. starting from the top: 250 kDa, 150 kDa, 100 kDa, 75 kDa, 50 kDa, 37 kDa, 25 kDa, 20 kDa; Lane b, cell extract protein from E. coli before induction with IPTG; Lane c, cell extract protein after induction with IPTG; Lane d, proteins after thermoprecipitation at 90°C and centrifugation; Lane e, purified SspCA from His-tag affinity column.
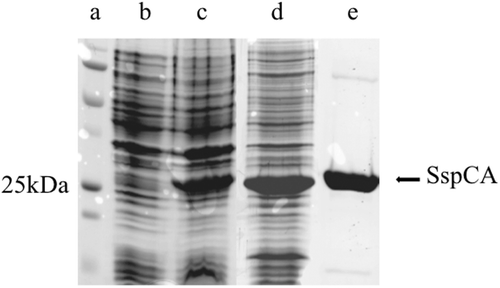
Table 2. Comparison of the hydratase and esterase activity for SspCA and bCA II.
Table 3. Comparison of the kinetic constants for SspCA and bCA II using CO2 or p-NpA as substrate.
Figure 2. Michaelis–Menten curves for the determination of the apparent Km and Vmax calculated using CO2 (A) or p-NpA (B) as substrate. The kinetic constant values are reported in . Inserts represent the Michaelis–Menten curve calculated for the mammalian enzyme (bCA II). Each point is the mean ±SEM of 3 independent determinations. Data have been analyzed by means of GraphPad Prism 5.0 software (GraphPad Software, San Diego, CA).
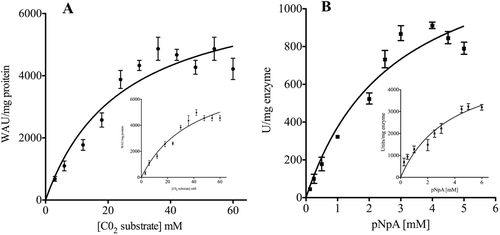
Figure 3. Effect of temperature on the activities of SspCA and bCA II. The enzyme activity was measured at the indicated temperatures and using p-NpA as substrate. SspCA, filled circle; bCA II, filled square.
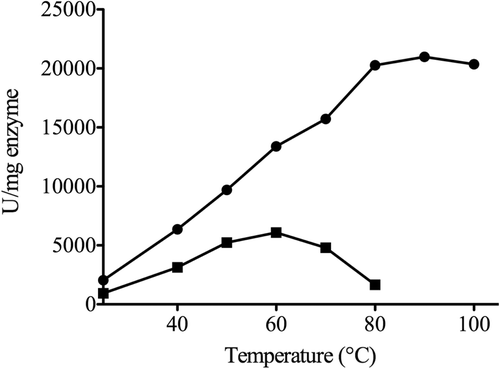
Figure 4. Thermostability of SspCA and bCA II. The enzymes were incubated for 30, 60, 120 and 180 min at the indicated temperatures and assayed using CO2 as substrate. (A) thermostability of SspCA; (B) thermostability of bCA II.
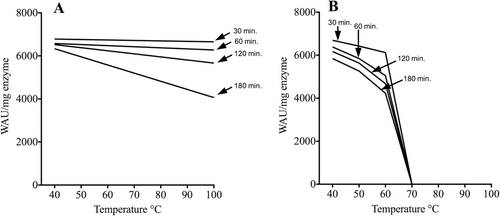
Table 4. Comparison of the hydratase activity for the immobilized SspCA and bCA II.