Figures & data
Figure 1. Chemical structure of (E)-methyl 2-(7-chloroquinolin-4-ylthio)-3-(4 hydroxyphenyl) acrylate (QNACR).
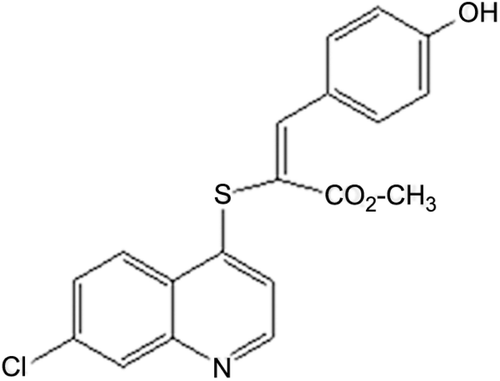
Table 1. Comparison of the cytotoxic effect of QNACR with cisplatin and doxorubicin.
Figure 2. Effect of antioxidants on the cytotoxicity of QNACR (24.8 µM) on MCF7 cells. NAC (0.5 mM) and Trolox (0.1 mM) themselves resulted in the cell viability of 99.75 ± 2.2% and 103.12 ± 2.67, respectively, compared to untreated control. Results are expressed as the mean ± SEM. ***p < 0.001.
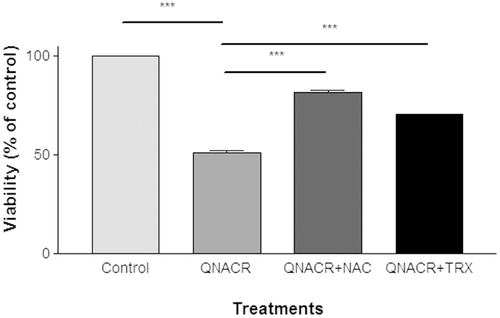
Figure 3. Effect of QNACR (24.8 µM) on oxidative markers in MCF7 cells over the time. a) Reactive-oxygen species (ROS) levels. b) Thiobarbituric acid reactive species (TBARs) levels. Results are expressed as the mean ± SEM. (a) *p < 0.05 and ***p < 0.001. (b) ***p < 0.001 compared to control vehicle.
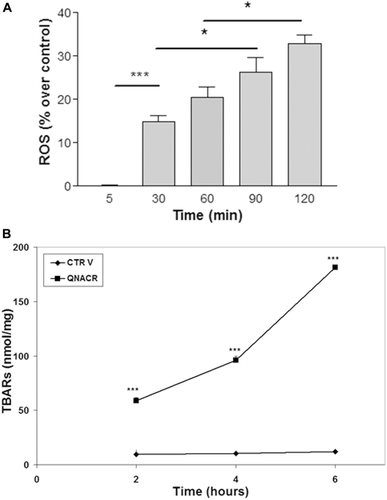
Table 2. Effect of QNACR (24.8 µM) on different antioxidant parameters over the time in breast cancer MCF7 cells.
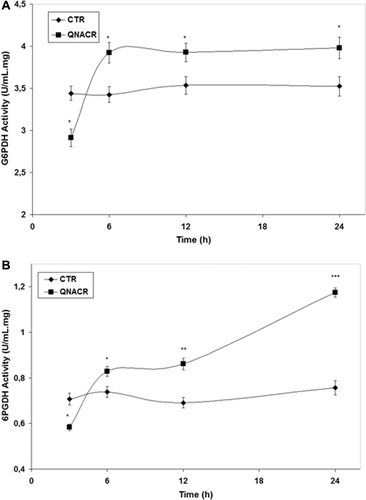
Figure 4. Effect of QNACR (24.8 µM) on the activity of the dehydrogenase enzymes of the penthose phosphate pathway. (a) G6PDH: glucose-6-phosphate dehydrogenase activity; (b) 6PGDH; 6-phosphogluconate dehydrogenase activity. Results are expressed as the mean ± SEM. *p < 0.05; **p < 0.01 and ***p < 0.001 compared to control vehicle.