Figures & data
Figure 1. Sequence alignment between EhHK1 and the human HK1 C-terminal half used as template. Alignment was made in SWISS-MODEL WorkspaceCitation19.
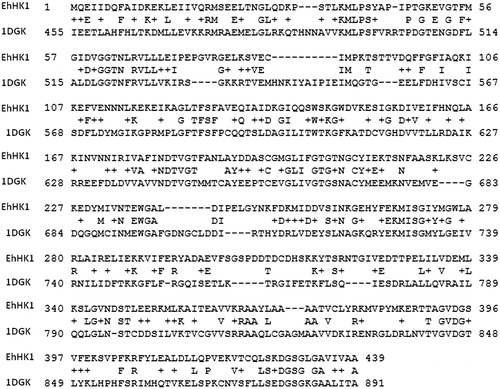
Figure 2. EhHK1 model Ramachandran map. Image shows residues in disallowed regions.
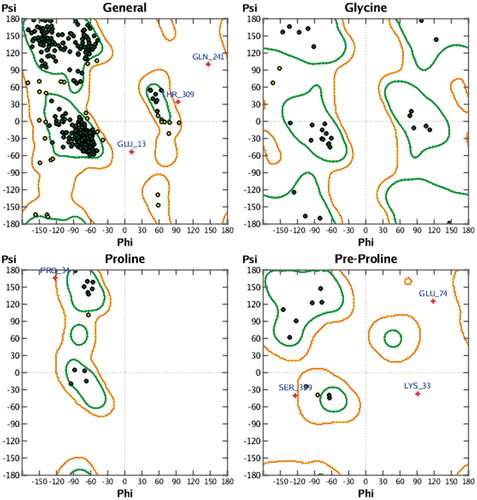
Figure 3. EhHK1 model QMEAN evaluation. (A) Normalised QMEAN6 score graphic showing the Z-score value, and the position (circle) of the model in the set of PDB structures used for evaluation. (B) EhHK1 model in ribbons, virtual screening site was located at the center in a region with less than 1 Å deviation, according to the estimated per-residue inaccuracy.
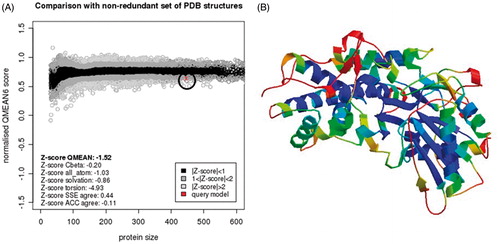
Figure 4. EhHK1 3D model showing the Gaussian surface of predicted ATP binding site used for virtual screening.
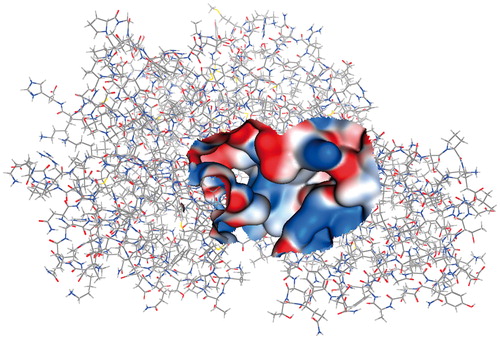
Figure 5. EhHK1 elution profile. The principal peak corresponds to a molecular weight of 53.8 kDa. The second peak represents less than 5% of total area under curve.
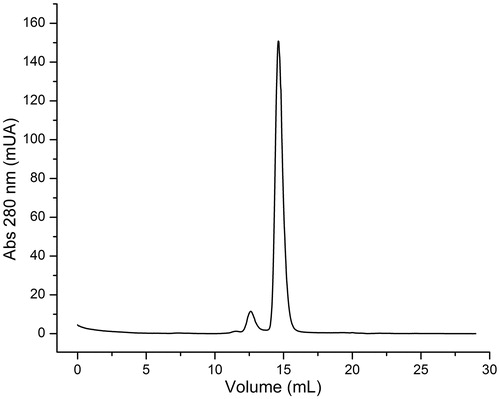
Table 1. EhHK1 kinetic parameters.
Figure 6. EhHK1 Inhibition by different concentrations of compounds 2755, 2921 and 11275. The I50 value was calculated adjusting the data to the equation described in “Materials and methods” section.
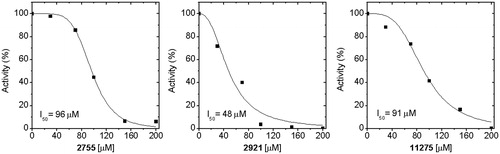
Table 2. EhHK1 inhibition by the 16 most active compounds found through virtual screening.
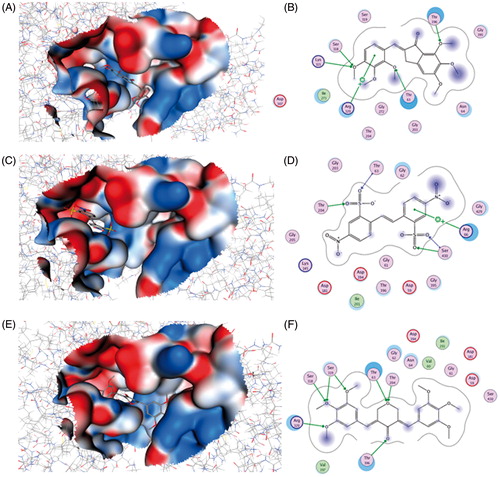
Figure 7. Binding of compounds 2755, 2921 and 11275 (A, C and E, respectively) into EhHK1 predicted ATP binding site. 2D Interactions map among the enzyme and compounds 2755, 2921 and 11275 (B, D and F, respectively). Arrows indicate H-bond formation, and a cross with an aromatic ring means cation–π interaction.