Figures & data
Scheme 1. Kinetic mechanism proposed to explain the monophenolase together with diphenolase and suicide inactivation pathways of tyrosinase acting on TBF/TBC (see Scheme 1SM for further details).
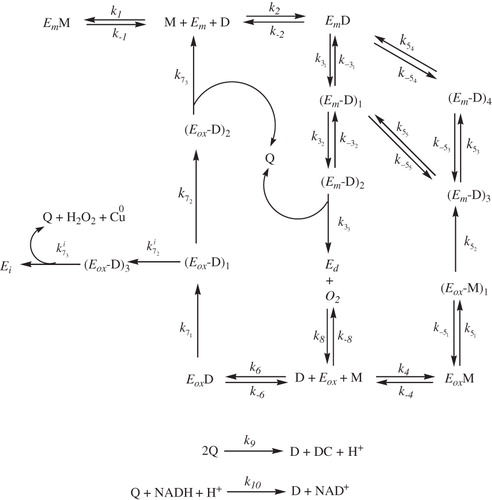
Figure 1. Spectrophotometric recordings to calculate the constant [TBC]ss/[TBF]ss in the steady state, . The experimental conditions are sodium phosphate buffer (pH 7.0) 30 mM, [E]0 = 36 nM, [TBF]0 = 0.3 mM and the initial [TBC]0 (µM) concentrations are: (a) 35, (b) 30, (c) 28, (d) 25, (e) 20, (f) 18 and (g) 15.
![Figure 1. Spectrophotometric recordings to calculate the constant [TBC]ss/[TBF]ss in the steady state, . The experimental conditions are sodium phosphate buffer (pH 7.0) 30 mM, [E]0 = 36 nM, [TBF]0 = 0.3 mM and the initial [TBC]0 (µM) concentrations are: (a) 35, (b) 30, (c) 28, (d) 25, (e) 20, (f) 18 and (g) 15.](/cms/asset/94677e7e-901d-45ee-bce8-8177998b1420/ienz_a_782298_f0002_b.jpg)
Figure 2. Oxymetric recordings of the suicide inactivation of tyrosinase in its action on TBF, varying the initial enzyme concentration. The experimental conditions are sodium phosphate buffer (pH 7.0) 30 mM, [TBF]0 = 0.5 mM, [TBC]0 = 25 µM and the initial enzyme (nM) concentrations are: (a) 0.008, (b) 0.017, (c) 0.026, (d) 0.034, (e) 0.044, (f) 0.052 and (g) 0.06. Inset. Representation of (ˆ) and
(•) versus
.
![Figure 2. Oxymetric recordings of the suicide inactivation of tyrosinase in its action on TBF, varying the initial enzyme concentration. The experimental conditions are sodium phosphate buffer (pH 7.0) 30 mM, [TBF]0 = 0.5 mM, [TBC]0 = 25 µM and the initial enzyme (nM) concentrations are: (a) 0.008, (b) 0.017, (c) 0.026, (d) 0.034, (e) 0.044, (f) 0.052 and (g) 0.06. Inset. Representation of (ˆ) and (•) versus .](/cms/asset/369e7000-e0a3-4b07-ae02-9ce876780013/ienz_a_782298_f0003_b.jpg)
Figure 3. Spectrophotometric recordings of the suicide inactivation of tyrosinase in its action on TBF, varying the initial enzyme concentration. The experimental conditions are sodium phosphate buffer (pH 7.0) 30 mM, [TBF]0 = 0.1 mM, [TBC]0 = 5 µM and the initial enzyme (nM) concentrations are: (a) 0.045, (b) 0.05, (c) 0.067 and (d) 0.075. The curves (e)–(h) represent the action of the enzyme on TBC. The experimental conditions are the same as curves (a)–(d), but [TBF]0 = 0 and [TBC]0 = 9 mM. The initial enzyme concentrations (nM) are: 0.30 (e), 0.32 (f), 0.34 (g) and 0.37 (h). Inset A. Representation of (ˆ) and
(•) versus
. Inset B. Representation of
(ˆ) and
(•) versus
.
![Figure 3. Spectrophotometric recordings of the suicide inactivation of tyrosinase in its action on TBF, varying the initial enzyme concentration. The experimental conditions are sodium phosphate buffer (pH 7.0) 30 mM, [TBF]0 = 0.1 mM, [TBC]0 = 5 µM and the initial enzyme (nM) concentrations are: (a) 0.045, (b) 0.05, (c) 0.067 and (d) 0.075. The curves (e)–(h) represent the action of the enzyme on TBC. The experimental conditions are the same as curves (a)–(d), but [TBF]0 = 0 and [TBC]0 = 9 mM. The initial enzyme concentrations (nM) are: 0.30 (e), 0.32 (f), 0.34 (g) and 0.37 (h). Inset A. Representation of (ˆ) and (•) versus . Inset B. Representation of (ˆ) and (•) versus .](/cms/asset/39016d90-441c-40da-94b3-7912ebd5d874/ienz_a_782298_f0004_b.jpg)
Table 1. Kinetic constants which characterize the suicide inactivation of tyrosinase by TBC and values of the chemical shifts of this compound obtained by Citation13C-NMR for the C-2 and C-1 carbons at pH 7.0*.
Figure 4. Residual activity, A/A0, corresponding to the irreversible inactivation of by TBC and its protection by TBF. The form
was obtained as described in the section “Material and methods” and immediately incubated with o-diphenol (TBC) in the presence of monophenol (TBF) or in its absence, taking aliquots at different times to measure the residual activity with [TBC]0 = 9 mM (
= 400 nm). The experimental conditions were: 30 mM sodium phosphate buffer (pH 6.0), 25 °C,
= 0.1 µM (see “Material and methods” section). The [TBC]0 concentrations were (µM): (a) 10 •, (b) 20 ˆ, (c) 35 ▪, (d) 50 □, (e) 60 ▴, (f) 80 ▵, (g) 100 ▾ and (h) 120 ▿. The experimental results follow Equation (8) and the apparent inactivation constants follow Equation (9). Inset. Representation of the values of
versus [TBC]0 in the absence (•) of TBF. In the presence of TBF (ˆ) ([TBF]0 = 40 µM), the experimental results follow Equation (10) to calculate
. These results were substituted into Equation (11) to obtain
and its analysis by Equation (12) gives
.
![Figure 4. Residual activity, A/A0, corresponding to the irreversible inactivation of by TBC and its protection by TBF. The form was obtained as described in the section “Material and methods” and immediately incubated with o-diphenol (TBC) in the presence of monophenol (TBF) or in its absence, taking aliquots at different times to measure the residual activity with [TBC]0 = 9 mM ( = 400 nm). The experimental conditions were: 30 mM sodium phosphate buffer (pH 6.0), 25 °C, = 0.1 µM (see “Material and methods” section). The [TBC]0 concentrations were (µM): (a) 10 •, (b) 20 ˆ, (c) 35 ▪, (d) 50 □, (e) 60 ▴, (f) 80 ▵, (g) 100 ▾ and (h) 120 ▿. The experimental results follow Equation (8) and the apparent inactivation constants follow Equation (9). Inset. Representation of the values of versus [TBC]0 in the absence (•) of TBF. In the presence of TBF (ˆ) ([TBF]0 = 40 µM), the experimental results follow Equation (10) to calculate . These results were substituted into Equation (11) to obtain and its analysis by Equation (12) gives .](/cms/asset/4b8626ae-5ab0-4d60-a129-e97afe7882c1/ienz_a_782298_f0005_b.jpg)
Table 3. Kinetic constants which characterize the inactivation of ,
and
by TBC and their protection by TBF under anaerobic conditions. The constants were obtained using the equations indicated.
Figure 5. Residual activity, A/A0, corresponding to the irreversible inactivation of by TBC and its protection by TBF. The form
was obtained as described in the section “Material and methods” and immediately incubated with o-diphenol (TBC) in the presence of monophenol (TBF) or in its absence, taking aliquots at different times to measure the residual activity with 9 mM TBC (
= 400 nm). The experimental conditions were: 30 mM sodium phosphate buffer (pH 6.0), 25 °C,
= 0.1 µM (see “Material and methods” section). The [TBC]0 concentrations were (µM): (a) 10 •, (b) 20 ˆ, (c) 50 ▪, (d) 100 □, (e) 150 ▴ and (f) 200 ▵. The experimental results follow Equation (8) and the apparent inactivation constants follow Equation (9). Inset. Representation of the values of
versus [TBC]0 in the absence (•) of TBF. In the presence of TBF (ˆ) ([TBF]0 = 40 μM), the experimental results were substituted into Equation (10) to calculate
. These results were again substituted into Equation (11) to obtain
and its analysis by Equation (12) gives
.
![Figure 5. Residual activity, A/A0, corresponding to the irreversible inactivation of by TBC and its protection by TBF. The form was obtained as described in the section “Material and methods” and immediately incubated with o-diphenol (TBC) in the presence of monophenol (TBF) or in its absence, taking aliquots at different times to measure the residual activity with 9 mM TBC ( = 400 nm). The experimental conditions were: 30 mM sodium phosphate buffer (pH 6.0), 25 °C, = 0.1 µM (see “Material and methods” section). The [TBC]0 concentrations were (µM): (a) 10 •, (b) 20 ˆ, (c) 50 ▪, (d) 100 □, (e) 150 ▴ and (f) 200 ▵. The experimental results follow Equation (8) and the apparent inactivation constants follow Equation (9). Inset. Representation of the values of versus [TBC]0 in the absence (•) of TBF. In the presence of TBF (ˆ) ([TBF]0 = 40 μM), the experimental results were substituted into Equation (10) to calculate . These results were again substituted into Equation (11) to obtain and its analysis by Equation (12) gives .](/cms/asset/5c46f988-5ec0-4a64-a4f9-ef42e8264fb9/ienz_a_782298_f0006_b.jpg)
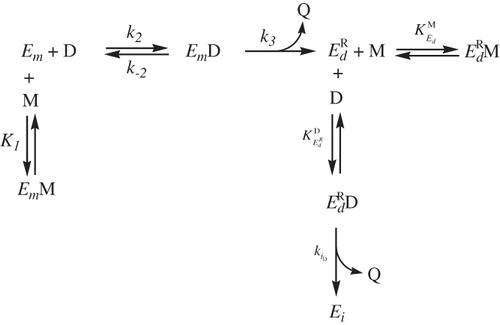
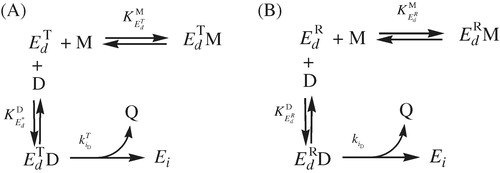
Scheme 2. (A) Effect of monophenols on , inactivation by o-diphenol. (B) Effect of monophenols on
, inactivation by o-diphenol.
Scheme 3. Effect of monophenols on , inactivation by o-diphenol.