Figures & data
Figure 1. Effect of pH on protease production (experimental conditions: incubation time 18 h, incubation temperature 35 °C, inoculum size 5%, glucose as carbon source, yeast extract as nitrogen source).
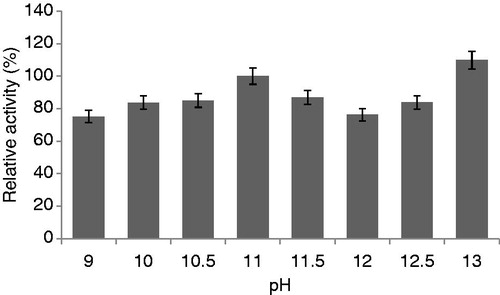
Figure 2. Effect of inoculum size on protease production (experimental conditions: incubation time 18 h, incubation temperature 35 °C, glucose as carbon source, yeast extract as nitrogen source, pH 11).
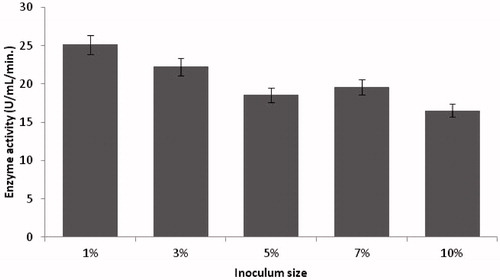
Figure 3. Effect of carbon sources on protease production (experimental conditions: incubation time 18 h, incubation temperature 35 °C, inoculum size 1%, yeast extract as nitrogen source, pH 11.0).
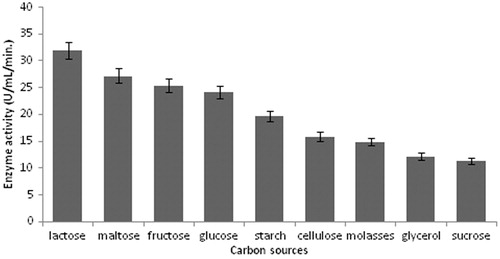
Figure 4. Effect of nitrogen sources on protease production (incubation time 18 h, incubation temperature 35 °C, inoculum size 1%, lactose as carbon source, pH 11.0).
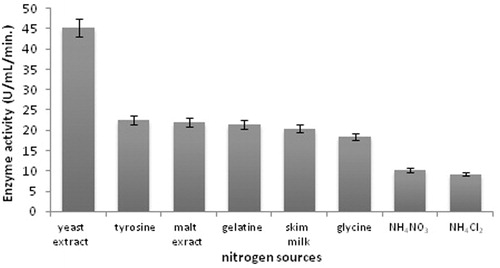
Figure 5. Effect of temperature on protease production (experimental conditions: incubation time 18 h, inoculum size 1%, lactose as carbon source, yeast extract as nitrogen source, pH 11.0).
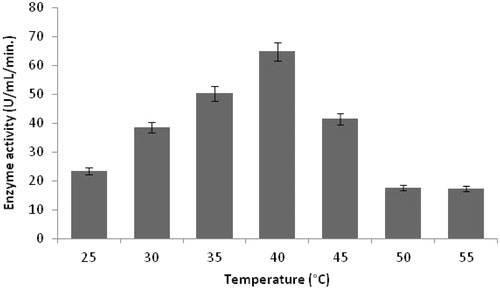
Figure 6. Effect of incubation time on protease production (incubation temperature 35 °C, inoculum size 1%, lactose as carbon source, yeast extract as nitrogen source, pH 11.0).
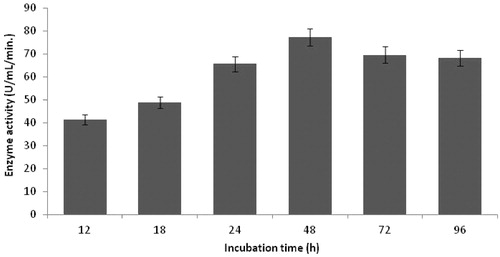
Table 1. Summary of the purification of an alkaline protease.
Figure 7. Effects of temperature on protease activity (experimental conditions: reaction pH 10.5, incubation time 20 min, lactose as carbon source, yeast extract as nitrogen source, pH 10.5).
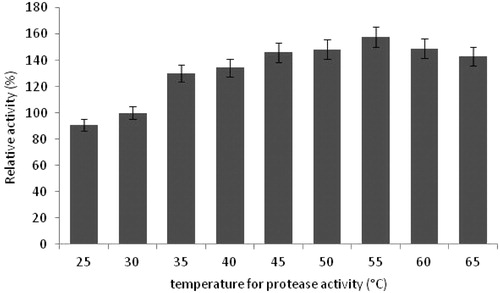
Figure 8. Effects of pH on protease activity (experimental conditions: reaction temperature 30 °C, incubation time 20 min, lactose carbon source, yeast extract as nitrogen source).
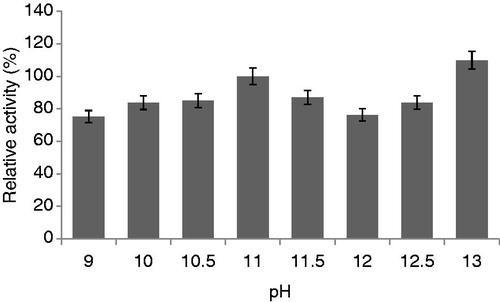
Table 2. Effects of heavy metals on protease activity (experimental conditions: reaction temperature 30 °C, reaction pH 10.5, incubation time 20 min).
Figure 9. Effect of SDS concentration on relative activity of protease (the activity in the absence of SDS, referred to 100% relative activity).
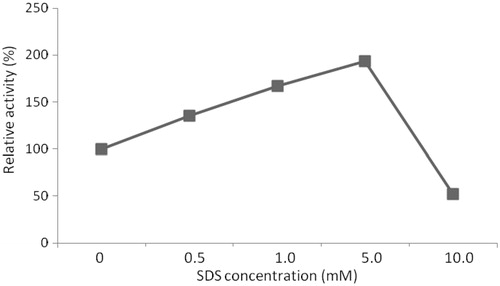
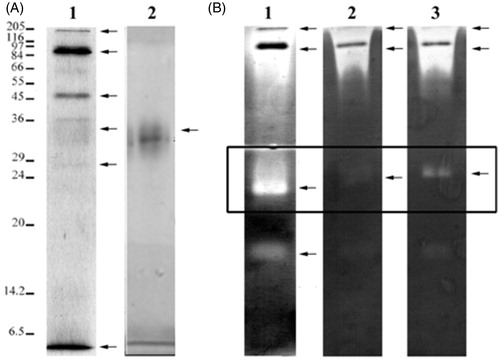
Figure 10. (A) Electrophoretic profiles of dialysate (lane 1) and purified enzyme (lane 2) by 12% SDS–PAGE under reducing conditions. Molecular weight markers are shown on the left. (B) Caseinolytic profiles of dialysate (lane 1) were performed by 12% SDS–PAGE–zymogram assay containing casein as a substrate. Zymograms were developed overnight at 37 °C in the presence of protease inhibitors as PMSF (lane 2) and EDTA (lane 3) at pH 10.5. Caseinolytic activity was observed as colorless bands.