Figures & data
Table 1. Distribution of CA families in Gram-negative/positive bacteria (for which the genome was cloned).
Figure 1. Role of α- and β-CA in the maintenance of periplasmic pH in Helicobacter pylori. (see text for details). Figure from referenceCitation14.
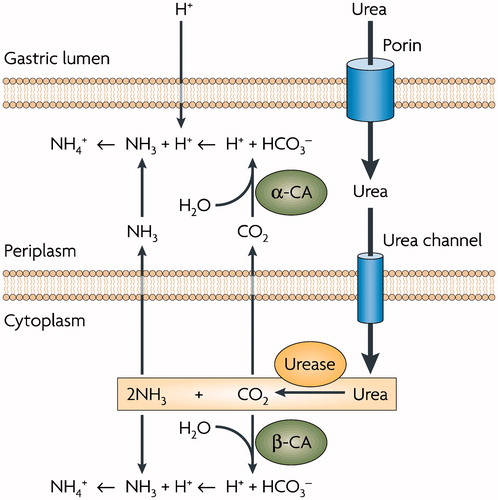
Figure 2. Phylogenetic analysis of the γ-CAs of the Gram-negative and -positive bacteria indicated in . The tree was constructed using the program PhyML 3.0. Branch support values are reported at branch point. Accession numbers of the amino acid sequences used in the phylogenetic analysis are given in .
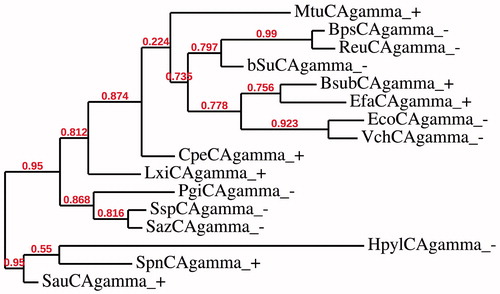
Figure 3. Phylogenetic analysis of the β-CAs of the Gram-negative and -positive bacteria indicated in . The tree was constructed using the program PhyML 3.0. Branch support values are reported at branch point. Accession numbers of the amino acid sequences used in the phylogenetic analysis are given in .
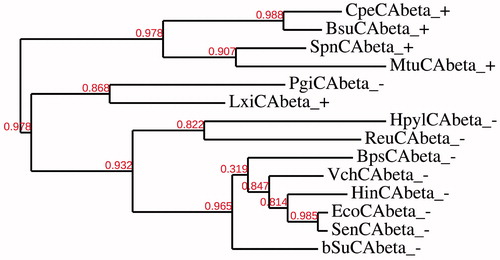
Figure 4. Phylogenetic analysis of the α-, β- and γ-CAs of the Gram-negative and -positive bacteria indicated in . The tree was constructed using the program PhyML 3.0. Branch support values are reported at branch point. Accession numbers of the amino acid sequences used in the phylogenetic analysis are given in .
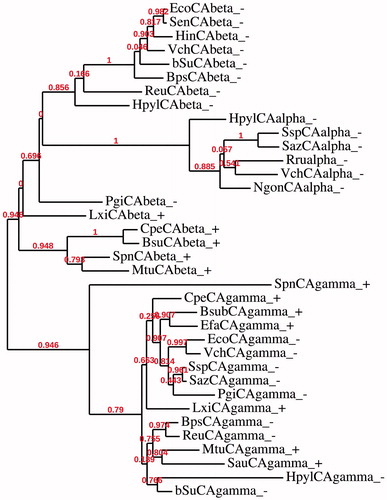
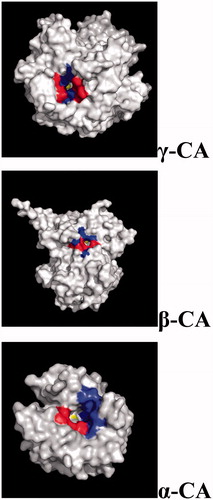
Figure 5. Three-dimensional structure of gamma- (Cam), beta- (Can2) and alpha- (hCA II) CAs, with a view of the catalytic pocket.