Figures & data
Figure 1. Molecular structures of THI (1, 2-acetyl-4-((1R,2S,3R)-1,2,3,4-tetrahydroxybutyl)imidazole), pyridoxal-5′-phosphate (2) and ATP (3).
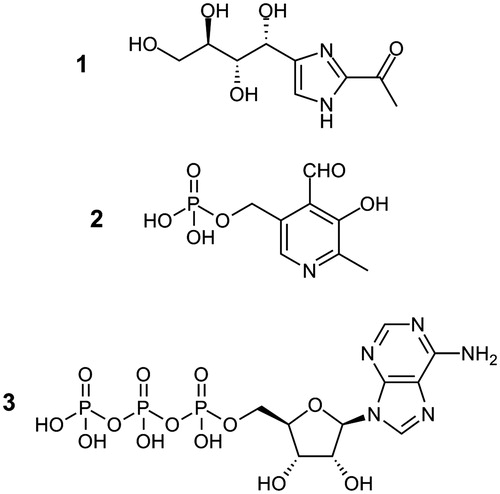
Figure 2. Schematic representation of the pathways describing the interaction of pyridoxal kinase (E) with its two substrates pyridoxal (A) and ATP (B) and their corresponding products pyridoxal-5′-phosphate (P) and ADP (Q).
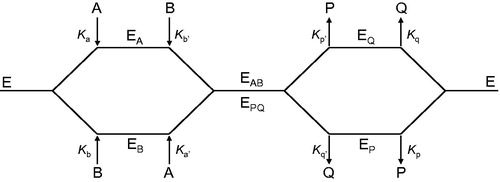
Figure 4. Kinetic analysis of pyridoxal kinase inhibition by THI with respect to the cosubstrate ATP shows that THI acts as a non-competitive inhibitor. Lineweaver–Burk (top) and secondary plots (middle, bottom) reveal the inhibition constants Ki = 5.3 mM and Kii = 23.0 mM. Mean values with standard errors are shown from duplicate or triplicate measurements; THI concentrations: • 0 mM, ▪ 4.2 mM, ▴ 7.5 mM, ▾ 15.0 mM and ♦ 20.0 mM.
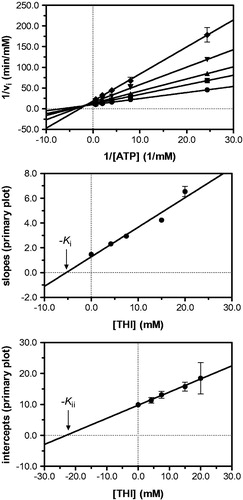
Figure 3. Kinetic analysis of pyridoxal kinase inhibition by THI with respect to the substrate pyridoxal (PL) shows that THI acts as a competitive inhibitor. Lineweaver–Burk (top) and secondary plots (middle, bottom) reveal a Kii inhibition constant of 11.2 mM. Mean values with standard errors are shown from duplicate or triplicate measurements; THI concentrations: • 0 mM, ▪ 4.2 mM, ▴ 7.5 mM, ▾ 15.0 mM and ♦ 20.0 mM.
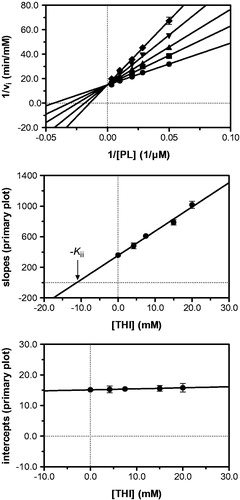
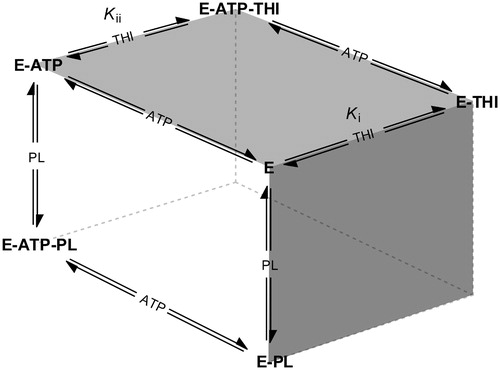
Figure 5. Schematic overview of competing equilibria describing the inhibition of pyridoxal kinase (E) by THI in the presence of both substrates pyridoxal (PL) and ATP (adapted from Asante-Appiah and ChanCitation34). Ki and Kii refer to the inhibition constants describing a random Bi Bi rapid equilibrium system in which PL and THI compete for the same enzyme binding site.