Figures & data
Table 1. Kinetic parameters for CO2 hydration reaction catalyzed by bCA and VchCA at 20 °C and pH 7.5. Ki for acetazolamide was 10 nM for bCA and 6.8 nM for VchCA.
Figure 1. Protonogram obtained at different concentrations of bCA. The yellow band corresponds to the bCA position on the gel responsible for the drop of pH from 8.2 to the transition point of the dye in the control buffer. Three different incubation times are used (5, 10 and 15 s).
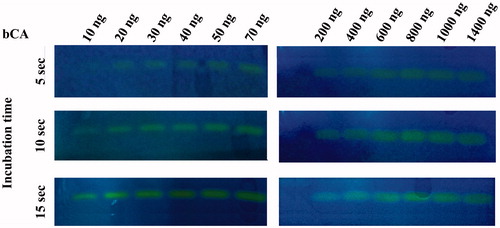
Figure 2. Protonogram obtained at different concentrations of VchCA. The yellow band corresponds to the VchCA position on the gel. Incubation times were 10, 20 and 30 s, higher than those indicated for bCA and shown in .
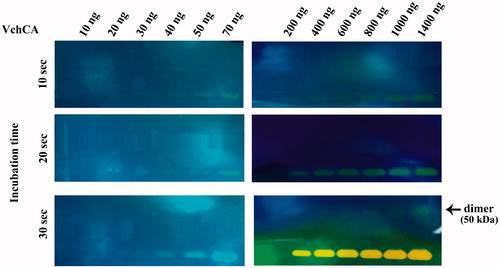
Figure 3. Comparison between the protonography and SDS-PAGE stained with Coomassie blue. Both gels were run under denaturing but non-reducing conditions. Gels were loaded with 4000 ng/well of bCA and VchCA, respectively. The incubation time in this case was 5 s.
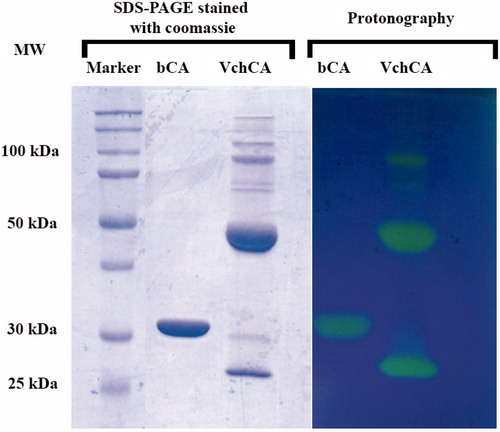
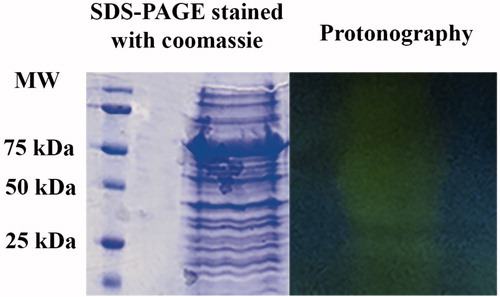
Figure 4. SDS-PAGE protonography using the whole cellular extract prepared from Escherichia coli cells. Both gels were run under denaturing but non-reducing conditions. Protonography shows two main yellow bands at a molecular weight ranging from 25 to 50 kDa (see text). Protonography thus evidenced an E. coli CA activity as described in the literature.