Figures & data
Figure 1. RMSD of the complex as a whole (bold/thick line) as well as that of the enzyme and the inhibitor separately (thin black and gray lines, respectively). We find that the enzyme part of the complex fluctuates around the X-ray structure throughout the length of the MD simulations. The inhibitor displays larger deviation from its initial state within the first 6 ns due to the equilibration period required for the missing residues that were manually modeled into the structure.
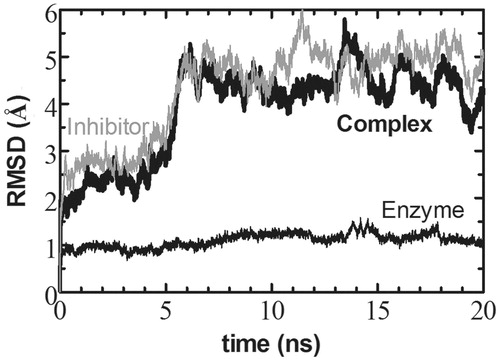
Figure 2. Subtilisin alignment in two states, 1OYV chain B representing the inhibited structure in light gray, and 1SBC for the apo form in dark gray are shown in cartoon representation. The overall structures are well-aligned while the two loops spanning Phe50–Gly61 and Ser159–Ile165 which display higher RMSD are shown in black.
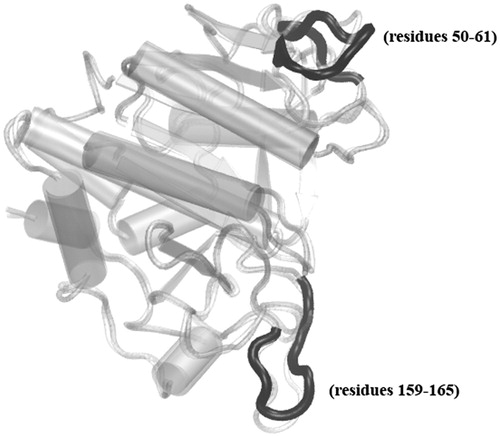
Figure 3. PRS map of the interconversion of TI-II/subtilisin complex to apo subtilisin. The displacements of the affected residues are displayed for the case which gives the best correlation for a given perturbed residue. Note that the displacements are on a relative scale, since PRS relies on linear response theory; i.e. if forces in a selected direction are modified by a factor r, then all displacements are also modified by the same factor r. Lower panel displays the relevant maximum Pearson correlation value for all residues. We select the residues that give the largest correlations as candidates controlling the conformational change.
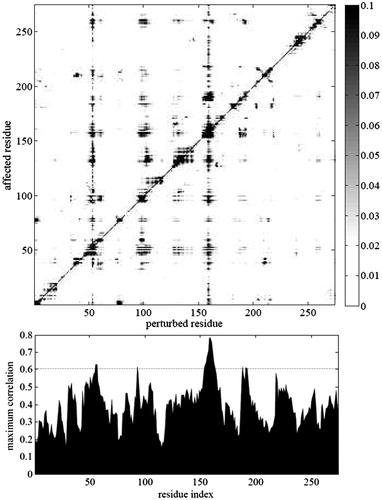
Table 1. Summary of PRS results. Hot residues are those with the highest Pearson correlation values in comparison to whole sequence.
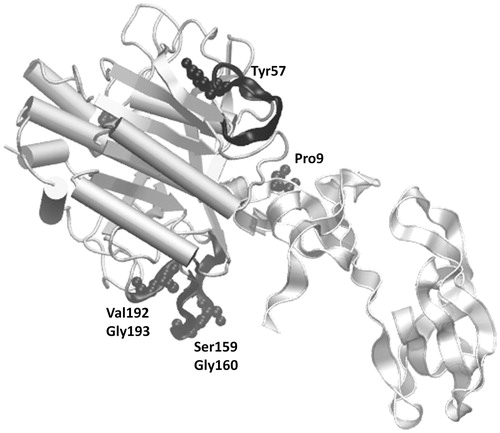
Figure 4. Residues specified by PRS as being effective in the transition of inhibitor bound subtilisin to apo subtilisin are displayed on the TI-II and subtilisin complex. The pronounced regions are displayed as black cartoons, while the residues with the largest correlations in a given region are further emphasized in ball-and-stick representation and labelled. TI-II is represented as gray colored transparent ribbon and subtilisin as silver colored cartoon.