Figures & data
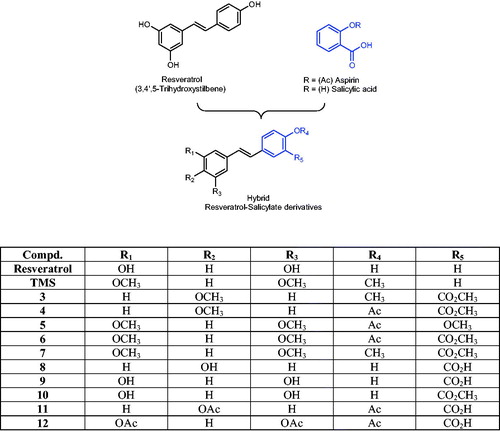
Figure 1. General design of resveratrol–salicylate hybrid compounds.
Scheme 1. Chemical synthesis of resveratrol–salicylate derivatives 3–12. Reagents and conditions: (i) n-butyllithium, dry THF, −78 °C for 2 h then room temperature for 12–18 h; (ii) Ph2S2, dry THF, reflux 4 h; (iii) BBr3, dry CH2Cl2, −60 °C then room temperature for 2 h; (iv) acetic anhydride, pyridine room temperature for 4 h.
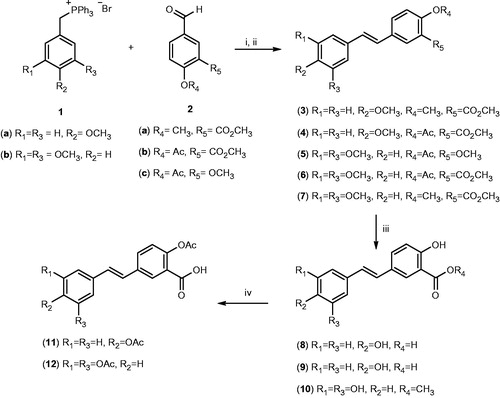
Figure 2. Effect of resveratrol and its analogs on TCDD-mediated induction of CYP1A1 catalytic activity in HepG2 cells. (A) Cells were pre-incubated with 5 μM of resveratrol (Res) or its analogs for 30 min before the addition of TCDD (1 nM) for an additional 24 h. The CYP1A1 activity level was determined using CYP1A1-dependent EROD assay. Values represent mean activity ± SEM (n = 8). (+) p < 0.05 compared with control (C), (*) p < 0.05 compared with TCDD. (B) The direct inhibitory effects of resveratrol and its analogs on CYP1A1 enzyme. HepG2 cells were pre-treated with TCDD (1 nM) for 24 h, thereafter, media were removed, washed thrice with PBS and 5 μM of the tested compounds in assay buffer [Tris (0.05 M), NaCl (0.1 M), pH 7.8] were added for 60 min prior to the addition of 7ER (2 μM final concentration) for the EROD measurement. Results are expressed as percentage of remaining EROD activity (mean ± SEM, n = 8). (*) p < 0.05 compared with control (C). ND: not detected.
![Figure 2. Effect of resveratrol and its analogs on TCDD-mediated induction of CYP1A1 catalytic activity in HepG2 cells. (A) Cells were pre-incubated with 5 μM of resveratrol (Res) or its analogs for 30 min before the addition of TCDD (1 nM) for an additional 24 h. The CYP1A1 activity level was determined using CYP1A1-dependent EROD assay. Values represent mean activity ± SEM (n = 8). (+) p < 0.05 compared with control (C), (*) p < 0.05 compared with TCDD. (B) The direct inhibitory effects of resveratrol and its analogs on CYP1A1 enzyme. HepG2 cells were pre-treated with TCDD (1 nM) for 24 h, thereafter, media were removed, washed thrice with PBS and 5 μM of the tested compounds in assay buffer [Tris (0.05 M), NaCl (0.1 M), pH 7.8] were added for 60 min prior to the addition of 7ER (2 μM final concentration) for the EROD measurement. Results are expressed as percentage of remaining EROD activity (mean ± SEM, n = 8). (*) p < 0.05 compared with control (C). ND: not detected.](/cms/asset/967c847a-18dd-434f-9ade-5ef6d7d1982c/ienz_a_979347_f0002_b.jpg)
Figure 3. Effects of stilbenes on CYP1A1 mRNA level. HepG2 cells were co-treated with 1 nM TCDD plus compound 3 (3) or 3,4′,5-trimethoxystilbene (TMS) at 5 µM for 6 h. First-strand cDNA was synthesized from total RNA (1.5 μg) extracted from HepG2 cells. cDNA fragments were amplified and quantitated using the ABI 7500 real-time PCR system as described in the experimental section. Duplicate reactions were performed for each experiment, and the values presented as the mean ± SE (n = 6). (*) p < 0.05 compared to control (DMSO; C). (+) p < 0.05 compared to TCDD alone.
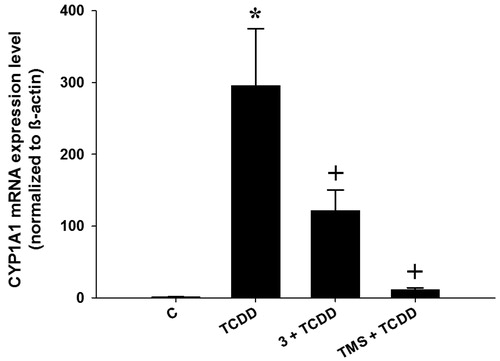
Figure 4. Binding mode for 2,4′,5-trimethylstilbene (TMS) in the active site of CYP1A1. 3D figures were generated using PyMOL Molecular Graphics System (DeLano Scientific LLC, Palo Alto, CA, 2007); 2D figures were generated according to a procedure described in the literatureCitation47.
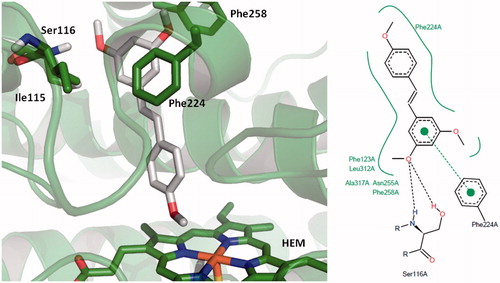
Figure 5. Comparison of the binding mode calculated for trimethylstilbene (TMS; shown in grey), with that observed for compounds (A) 3 (cyan), 4 (purple), 5 (orange), 6 (yellow); (B) 7; (C) 8 (purple), 9 (orange); (D) 10 (purple), 11 (blue) and 12 (yellow) in the active site of human CYP1A1. 3D figures were generated using PyMOL Molecular Graphics System (DeLano Scientific LLC, Palo Alto, CA, 2007).
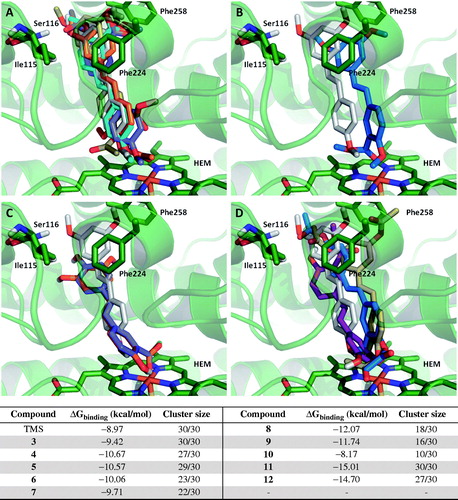
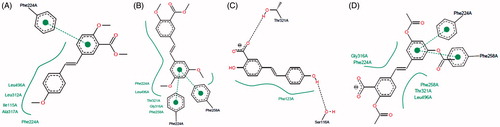
Figure 6. Two-dimensional representation of the binding interactions observed between the active site of CYP1A1 and compounds (A) 3; (B) 7, (C) 8 and (D) 12. 2D figures were generated according to a procedure described in the literatureCitation47.