1,698
Views
21
CrossRef citations to date
0
Altmetric
Research Article

Novel synthesis scheme and in vitro antimicrobial evaluation of a panel of (E)-2-aryl-1-cyano-1-nitroethenes

, , , , , , , & show all
Pages 900-907 | Received 22 Apr 2015, Accepted 09 Jun 2015, Published online: 30 Jul 2015

Figures & data

Table 1. Yield of synthesis of nitroalkenes A1A7 and their melting points.

Table 2. The antimicrobial activity data expressed as MIC (MBC or MFC) [µg/ml] against the reference strains of microorganisms for compounds A1A7.

Table 3. The antimicrobial activity data expressed as MBC/MIC and MFC/MIC against the reference strains of microorganisms for compounds A1A7.

Scheme 1. Synthetic pathway leading to (E)-2-aryl-1-cyano-1-nitroethenes (A2A7).

Scheme 1. Synthetic pathway leading to (E)-2-aryl-1-cyano-1-nitroethenes (A2–A7).

Figure 1. Cytotoxicity of compounds A1A7 (a–g) against cultured HepG2 cells. HepG2 cells were treated with increasing concentrations of the compounds of interest (A1A7, a–g) or vehicle (DMSO, 0.1%) for 24 h. Cell viability was assessed using MTS assay. Mean absorbance value for DMSO-treated cells was set to 1. The data are expressed as mean ± SD from three independent experiments carried out in sextuplicates. Obtained IC50 values are listed in .

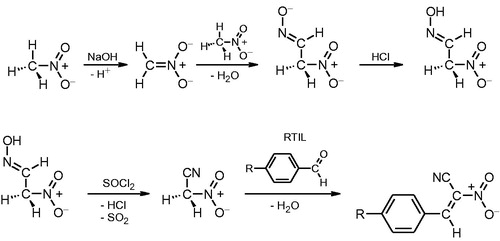
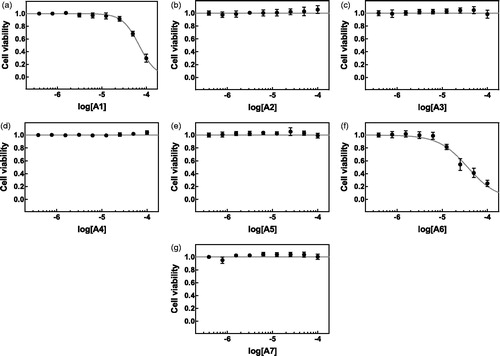
Figure 1. Cytotoxicity of compounds A1–A7 (a–g) against cultured HepG2 cells. HepG2 cells were treated with increasing concentrations of the compounds of interest (A1–A7, a–g) or vehicle (DMSO, 0.1%) for 24 h. Cell viability was assessed using MTS assay. Mean absorbance value for DMSO-treated cells was set to 1. The data are expressed as mean ± SD from three independent experiments carried out in sextuplicates. Obtained IC50 values are listed in Table 4.

Figure 2. Cytotoxicity of compounds A1A7 (a–g) against cultured HaCaT cells. HaCaT cells were treated with increasing concentrations of the compounds of interest (A1A7, a–g) or vehicle (DMSO, 0.1%) for 24 h. Cell viability was assessed using MTS assay. Mean absorbance value for DMSO-treated cells was set to 1. The data are expressed as mean ± SD from three independent experiments carried out in sextuplicates. Obtained IC50 values are listed in .

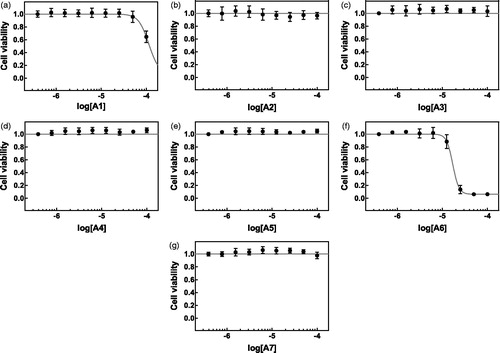
Figure 2. Cytotoxicity of compounds A1–A7 (a–g) against cultured HaCaT cells. HaCaT cells were treated with increasing concentrations of the compounds of interest (A1–A7, a–g) or vehicle (DMSO, 0.1%) for 24 h. Cell viability was assessed using MTS assay. Mean absorbance value for DMSO-treated cells was set to 1. The data are expressed as mean ± SD from three independent experiments carried out in sextuplicates. Obtained IC50 values are listed in Table 4.

Table 4. Summary of cytotoxic activities of A1–A7 compounds in HepG2 and HaCaT cell lines.

Reprints and Corporate Permissions

Please note: Selecting permissions does not provide access to the full text of the article, please see our help page How do I view content?

To request a reprint or corporate permissions for this article, please click on the relevant link below:

Academic Permissions

Please note: Selecting permissions does not provide access to the full text of the article, please see our help page How do I view content?

Obtain permissions instantly via Rightslink by clicking on the button below:

If you are unable to obtain permissions via Rightslink, please complete and submit this Permissions form. For more information, please visit our Permissions help page.