
Figures & data
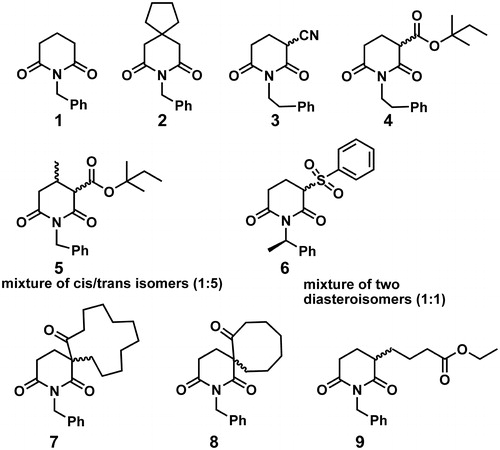
Figure 1. Structures of glutarimide derivatives 1–9.
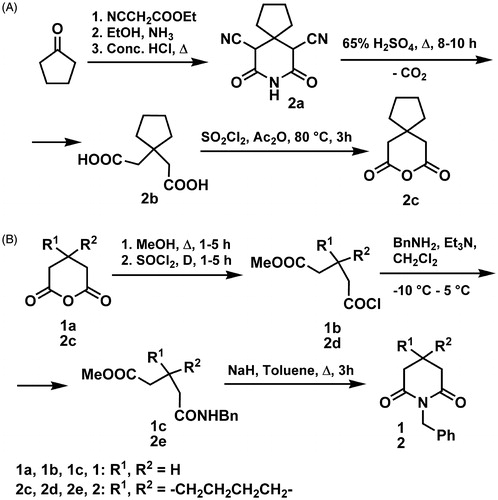
Scheme 1. Synthetic path to obtain compounds 1 and 2.
Scheme 2. Synthetic paths to obtain compounds (A) 3–6; and (B) 7–9.
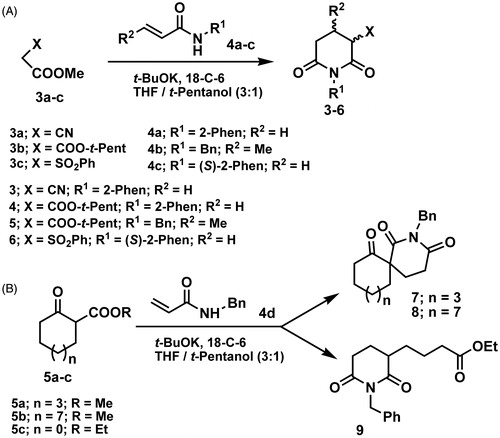
Table 1. Concentrations of compounds 1–9 that induced 50% decrease in cell survival (IC50).
Figure 2. Dose–response curves for the cytotoxicity of compound 7 toward HeLa, K562, MDA-MB-453 and MRC-5 cells. Percentage of viable cells (S%) was plotted against various concentrations of compound 7.
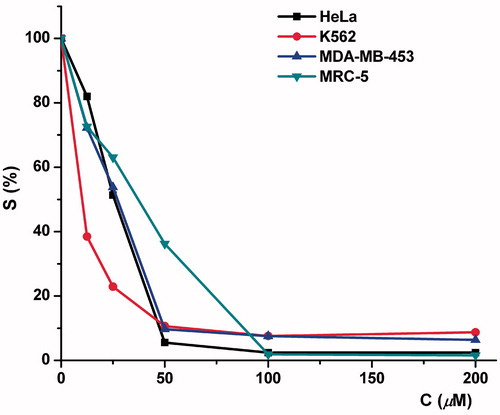
Figure 3. Heatmap depiction of descriptors (auto- and cross-correlograms), calculated by AMANDA algorithm, for compounds 1–9.
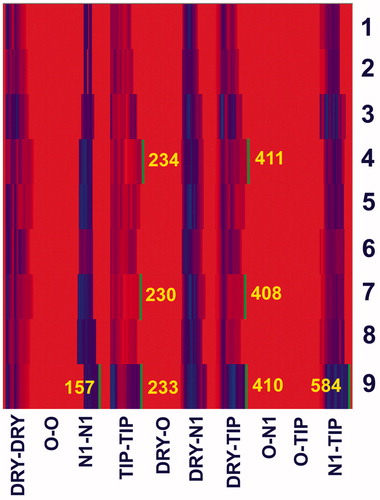
Table 2. Antibacterial activity of compounds 1, 2, 4, 6–8 and 9, determined by the disk diffusion method.
Table 3. Antibacterial activity of compounds 1, 2, 4, 6–8 and 9 expressed as MIC (mg/mL), determined by the broth microdilution method.
Supplemental material