Figures & data
Figure 1. The antileishmanial effects of withaferin A on promastigotes was determined after 72 h of treatment using MTT assay. The graph depicts the percentage viability of the parasites in the dose dependent concentrations of withaferin A. The values are representative of three values ± SD (*p <0.05, **p <0.01).
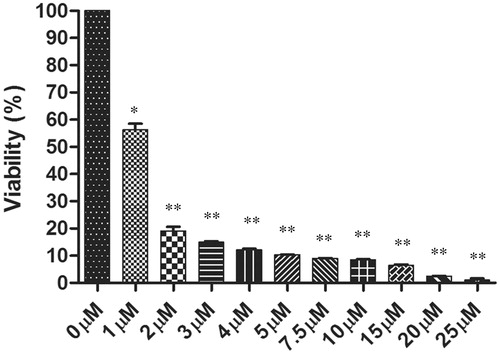
Figure 2. Predicted interaction model of withaferin A with LdPTR1 (a) space fill model of LdPTR1 with withaferin A docked to the binding site. (b) Red color shows alpha helices (spiral sheets), blue indicates beta sheets, dark blue indicates the residues interacting with withaferin A and pink indicates the withaferin A docked in the binding site. (c) Ball and stick model of the interacting residues in the LdPTR1 with the withaferin A.
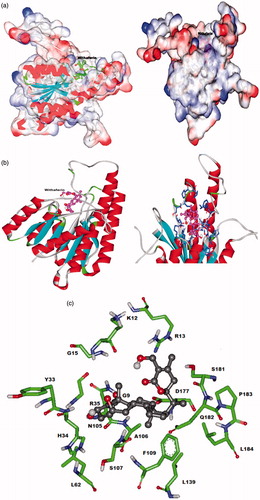
Figure 3. Agarose gel electrophoresis of the LdPTR1 gene product. (a) The figure shows the 867 bps amplified LdPTR1 product from the genomic DNA along with DNA ladder. (b) Restriction digestion of the positive clone plasmid showing the free insert (867 bps) and the plasmid (5.5 kb) with DNA ladder.
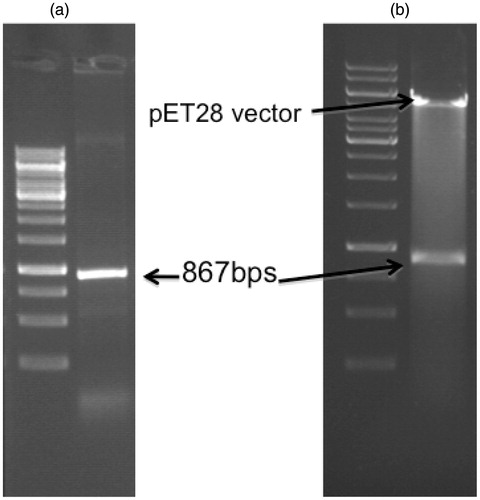
Figure 4. Induction and western blot of LdPTR1. (a) Proteins were separated on 12% SDS-PAGE before and after induction with 1 mM IPTG at different time points. The induced LdPTR1 (33 kDa) was represented in the figure. (b) Western blot analysis using anti-his antibody using the uninduced and induced crude lysate along with protein marker. The blot was developed using anti mouse ALP conjugate.
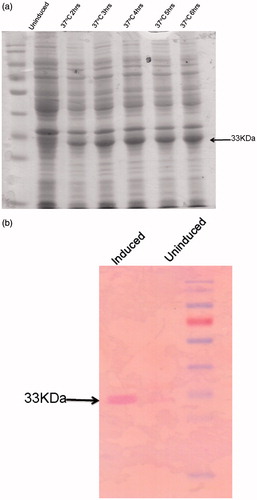
Figure 5. The expressed His-tag fusion protein was purified using a Ni2+ chelating Sepharose column affinity chromatography. The purified proteins were separated on 12% SDS-PAGE and stained with coomassie blue. Lane 1: protein marker, Lane 2: flow through, Lane 3–5: washes with the wash buffer, Lane 6 and 7: Elution of the protein with 200 mM imidazole.
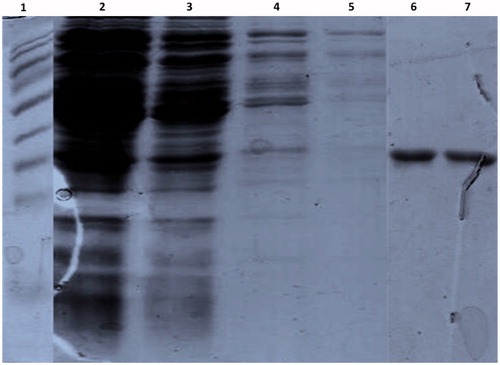
Figure 6. Enzyme kinetics of purified LdPTR1. (a) The optimum concentration of the enzyme was carried using 100 μM NADPH and 100 μM biopterin. It was found to be 0.696 μM, which was used for further assays. (b) The recombinant LdPTR1 enzyme assay was performed using 20 mM sodium acetate buffer (pH 4.8) for the different concentrations of substrate biopterin. (c) The enzyme inhibition studies were performed for methotrexate and withaferin A using lineweaver Burk plot. The Ki values for each compound were calculated from the graph. The experiments were repeated three times and figure represents the result from one such experiment.
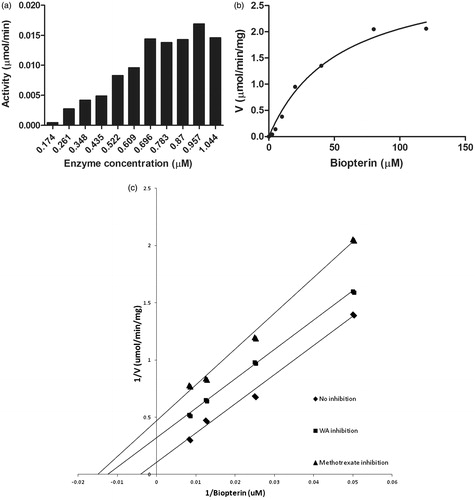
Figure 7. PTR1 enzyme activity was determined in the crude parasite lysates of control and withaferin A treated at different time intervals. The values are representative of three independent experiments and significant values indicate the comparison of control with treated samples at that particular time point.
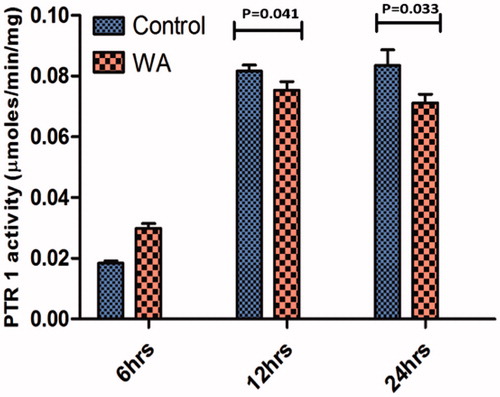
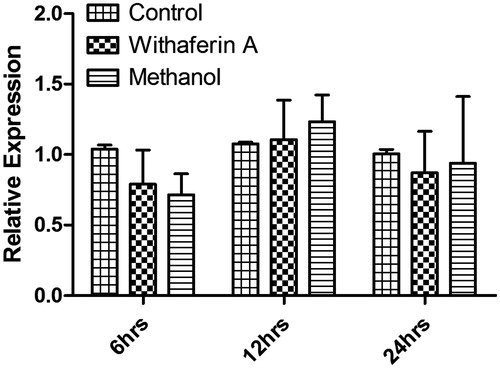
Figure 8. Endogenous mRNA expression levels of PTR1 in control, withaferin A and methanol-treated parasites at different time intervals. The graph represents the relative expression of PTR1 mRNA normalized with β-actin. The values are representative of three independent experiments.