Figures & data
Figure 1. Circular dichroism spectra of HRP in absence (control) and presence of vanadyl curcumin (VO(cur)2) and vanadyl diacetylcurcumin (VO (DAC)3). The molar ratio of HRP to the both curcumin complexes is 1:1.
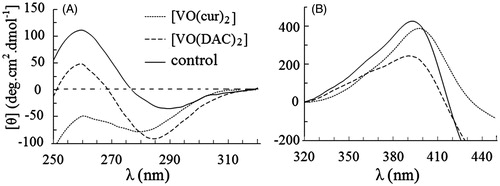
Figure 2. Intrinsic fluorescence spectra of HRP excited at 280 nm (A) and 295 nm (B) in 0–20 µM concentrations of vanadyl diacetylcurcumin. In the inset figures fluorescence intensity at λmax has been plotted against molar concentration of the complex.
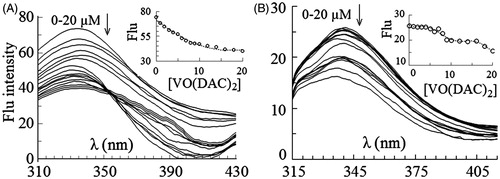
Figure 3. Intrinsic fluorescence spectra of HRP excited at 280 nm (A) and 295 nm (B) in 0–20 µM concentrations of vanadyl curcumin (B). In the inset figures fluorescence intensity at λmax has been plotted against molar concentration of the complex.
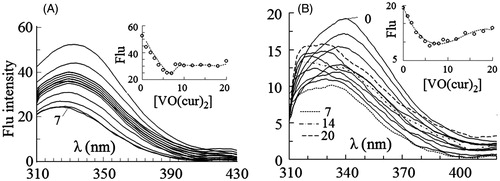
Figure 4. Percentage of activity of HRP at different concentrations of vanadyl curcumin (VO(cur)2) and vanadyl diacetylcurcumin (VO(DAC2). Inset shows the rate of HRP reaction (V) at various concentrations of the complexes.
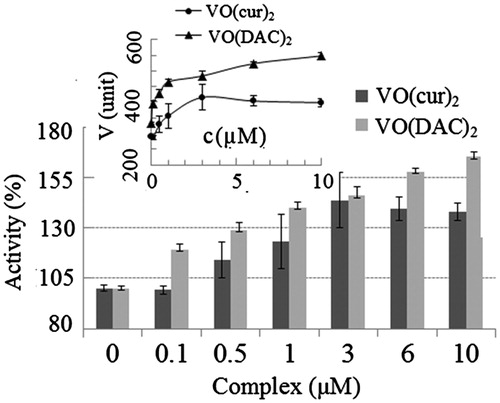
Figure 5. The rate of reaction of HRP (V) at different concentrations of hydrogen peroxide in absences (0) and presence of 1–3 µM (1, 2 and 3) vanadyl curcumin (A) and vanadyl diacetylcurcumin (B). In the inset figures, the enzyme activity was considered 100% in the absence of the complex.
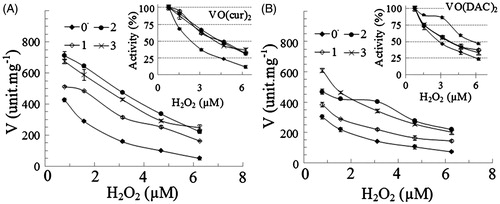
Figure 6. Percentage of decrease in activity of HRP on the oxidative condition (at 3.12 µM concentration of H2O2 that is four-fold more than the optimum concentration of H2O2 for the enzymatic assay of HRP) at various concentrations of vanadyl curcumin (VO(cur)2) and vanadyl diacetylcurcumin (VO(DAC)2).
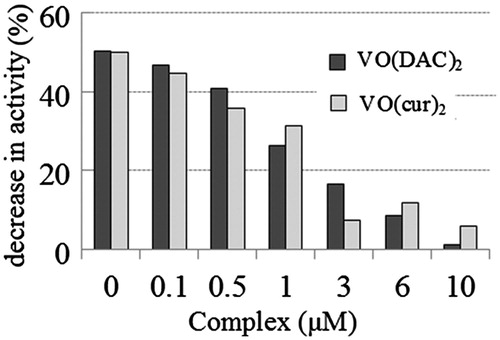
Table 1. IC50 values (µM) of hydrogen peroxide in absence (control) and presence of 1, 2 and 3 µM vanadyl curcumin (VO(cur)2) and vanadyldiacetylcurcumin (VO(DAC)3).
Table 2. Michaelis constant for H2O2 substrate (1 Km) and phenol substrate (2 Km), maximum rate of the enzymatic reaction (Vmax), catalytic rate constant (kcat) and catalytic efficiency (kcat/km) of HRP in the absence (control) and presence of 0.5 and 3 µM vanadyl curcumin (VO(cur)2).
Table 3. Michaelis constant for H2O2 substrate (1 Km) and phenol substrate (2 Km), maximum rate of the enzymatic reaction (Vmax), catalytic rate constant (kcat) and catalytic efficiency (kcat/Km) of HRP in the absence (control) and presence of 0.5 and 3 µM vanadyl diacetylcurcumin (VO(DAC)2).
Table 4. Activation energy of the enzymatic reaction (Ea), the free energy of activation (ΔG#), the enthalpy of activation (ΔH#) and the entropy of activation (ΔS#) in the absence (control) and presence of 3 µM vanadylcurcumin (VO(cur)2) and vanadyldiacetylcurcumin (VO(DAC)3).
Figure 7. Viability of MCF-7 (C135) breast cancer, bladder (C5637) and LNCaP (C439) prostate carcinoma cell lines at various concentrations of vanadyl curcumin (VO(cur)2) assayed by MTT method.
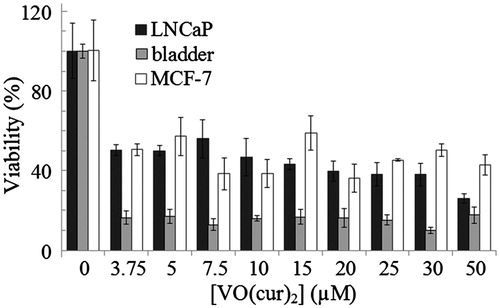
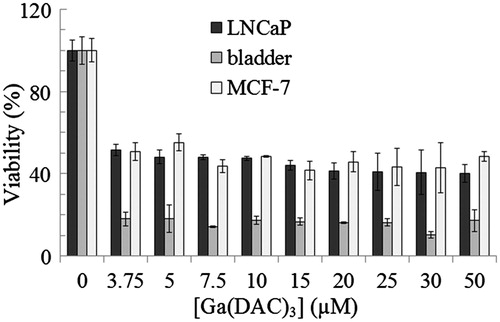
Figure 8. Viability of MCF-7 (C135) breast cancer, bladder (C5637) and LNCaP (C439) prostate carcinoma cell lines at various concentrations of vanadyl diacetylcurcumin (VO(DAC)2) assayed by MTT method.