Figures & data
Figure 1. Nucleotide and translated amino acid (bold letters) sequences of MgCA. The open reading frame is indicated by capital letters. Zinc ligands are indicated in red, while the catalytic dyad involved in the activation of the zinc-coordinated water in blue. .
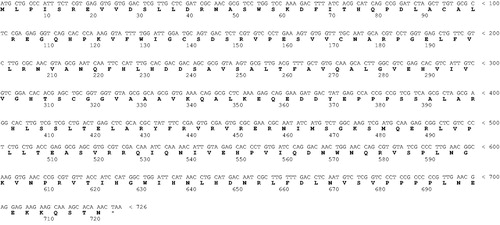
Figure 2. Blast output reporting the first 33 sequences. By going down the list, it is possible to see less than perfect matches, slowly degrading as the corresponding score decreases and the E value increases. The E value is an assessment of the statistical significance of the score. E value close to 1 is a warning that the alignment is not reliable.
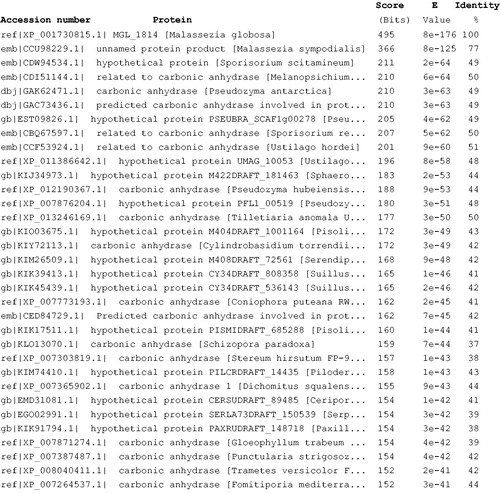
Figure 3. SDS-PAGE of the recombinant MgCA purified from E. coli codon plus cells. Lane A, molecular markers, M.W. starting from the top: 250, 150, 100, 75, 50, 37, 25 and 20; Lane B, purified SspCA from His-tag affinity column.
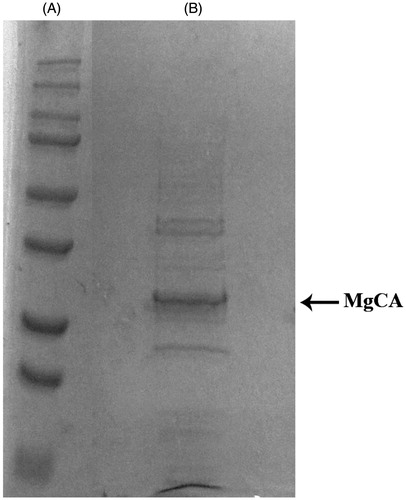
Table 1. Kinetic parameters for the CO2 hydration reaction catalyzed by MG-CA (GST-fusion protein), MgCA (His-fusion protein), hCA I and II (α-CA from H. sapiens, isoform I and II, respectively) and Can2 (β-CA from C. neoformans).
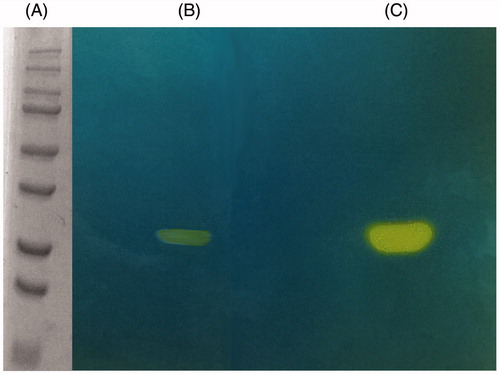
Figure 4. MgCA protonogram. The yellow bands correspond to the hydratase activity on the gel responsible for the drop of pH from 8.2 to the transition point of the dye. Incubation time was of 60 s. β-CA is present in the monomeric (29 kDa) form (see text for details). Lane A, molecular markers, M.W. starting from the top: 250, 150, 100, 75, 50, 37, 25 and 20 kDa; Lane B: MgCA; Lane C: commercial bovine CA (bCA).