Figures & data
Table 1. hCA I, II, VII, IX and XII inhibition data of the newly synthesized compounds 4–7 by a stopped flow CO2 hydrase assayCitation11. 
Figure 1. Evaluation of neurological score. Measurements were carried out 24 h after pMCAO. The protocol consisted of six tests in order to evaluate spontaneous activity, symmetry in the movement of four limbs, forepaw outstretching, climbing, body proprioception and response to vibrisse touch. The score assigned to each rat at completion of the evaluation equals the sum of all six test scores. The final minimum score was 3, and the maximum was 18. Each value represents the mean ± SEM of five rats per group. **p < 0.01 versus sham + vehicle-treated rats; ^p < 0.05 versus pMCAO + vehicle-treated rats.
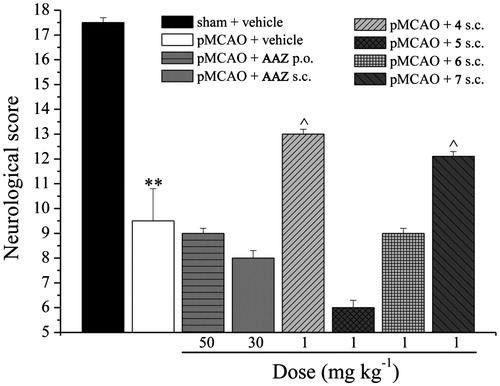
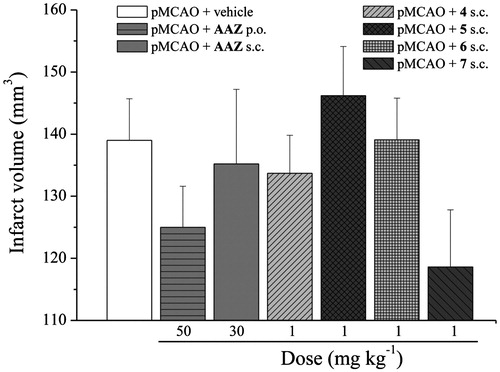
Figure 2. Effect of CA inhibitors on infarct volume after pMCAO. The evaluation was performed 24 h after surgery. Coronal brain slices (2 mm) were incubated with TTC and infarct volume was calculated multiplying the infarct area by the distance among sections (2 mm). Each value represents the mean ± SEM of five rats per group.