Figures & data
Figure 1. Purification of NCBBTI by liquid chromatography techniques. (A) Crude extract of Northeast China black beans was subjected to affinity chromatography on Affi-gel blue gel and the adsorbed fraction was eluted with 1 M NaCl. (B) Unadsorbed fraction B1 was loaded on a DEAE-Sepharose column and the adsorbed fraction was eluted with 0.2 M NaCl and 1 M NaCl. (C) Adsorbed fraction D2 was subsequently run on a Mono Q 5/50 GL column and the adsorbed fraction was eluted with three successive linear gradients of NaCl (0–0.2 in 5 ml, 0.2–0.25 M in 15 ml, 0.25–1 M in 5 ml) in 20 mM NH4HCO3 (pH 9.6) buffer. (D) Adsorbed fraction M2 fraction was separated by Superdex 75 10/300 GL column and the major peak S2 was found to the target protein. All fractions derived from each chromatography step were tested for tryspin inhibitory activity to make sure that the active fraction was chosen for further fractionation.
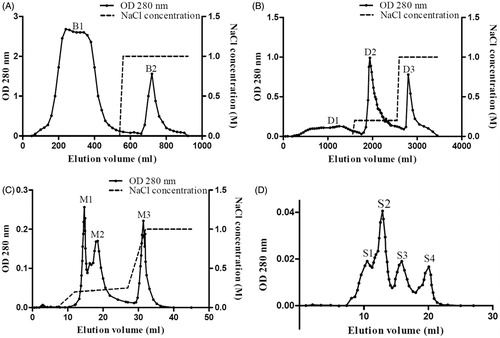
Figure 2. SDS–PAGE patterns of the purification of NCBBTI. From the right to the left, the lanes, respectively, represented the molecular weight marker proteins, the unbound fraction B1 from Affi-gel blue gel, the bound fraction D2 from DEAE-Sepharose, the bound fraction M2 from Mono Q and the fraction S2 from Superdex 75 and the molecular weight marker proteins.
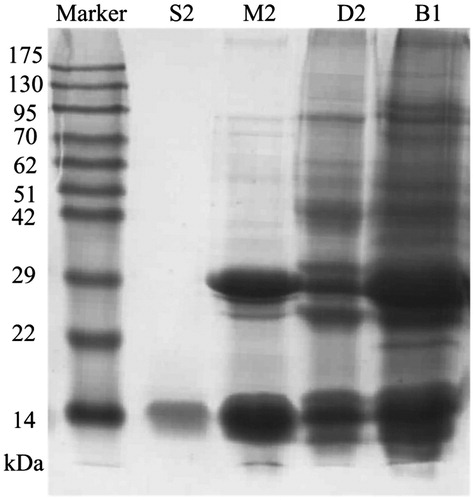
Table 1. Summary of purification of NCBBTI from 30 g Northeast China black beans.
Figure 3. Effect of (A) different temperatures and (B) pH values on NCBBTI. Results represent mean ± SD (n = 3).
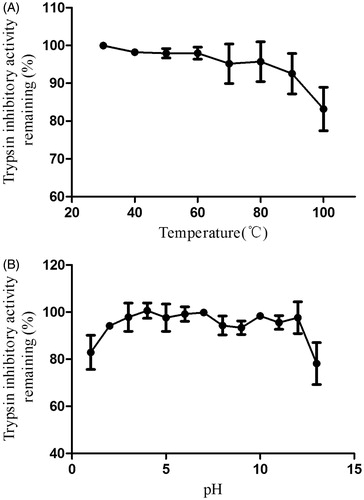
Figure 4. Inhibition rate (%) of DTT on the trypsin inhibitory activity of NCBBTI. NCBBTI were pretreated with different concentrations of DTT for 30 min before it was tested for trypsin inhibitory activity. A p values < 0.05 was considered as statistically significant, p < 0.05 (*), p < 0.01 (**), p < 0.001 (***) versus respective control groups. Results represent mean ± SD (n = 3).
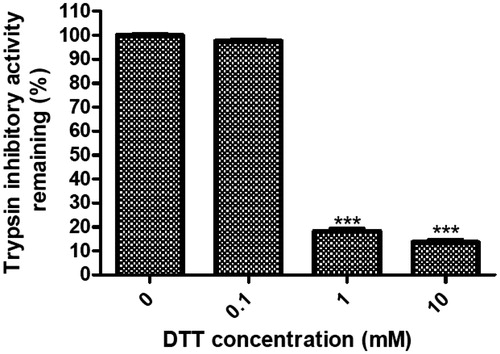
Figure 5. Proliferation inhibitory effect of (A) NCBBTI and (B) NCBBH on HONE-1 cells and CNE-1 cells. Cells were cultured with the medium containing different concentrations of NCBBTI and NCBBH for 48 h before the cell viability was measured. Results are represented as mean ± SD (n = 3).
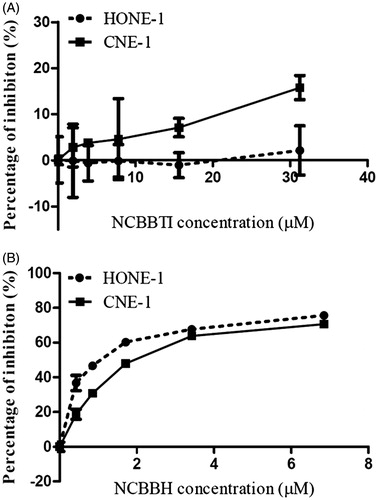
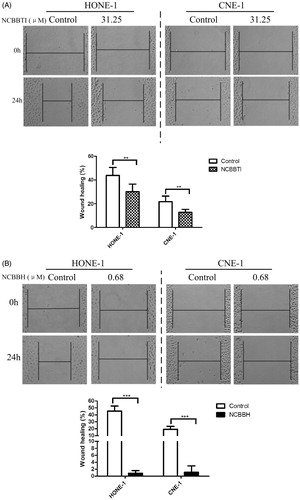
Figure 6. Wound-healing assay of NCBBTI and NCBBH on nasopharyngeal carcinoma cells. After the wound had been created, cells were cultured with FBS-free medium (control) or FBS-free medium containing (A) 31.25 μM NCBBTI or (B) 0.68 μM NCBBH for 24 h before the wound closure was measured. p < 0.05 (*), p < 0.01 (**), p < 0.001 (***) versus respective control groups. Results are represented as mean ± SD (n = 6).