Figures & data
Figure 1. The chromatography and activity profiles of xylarinase separated on Sephacryl S-300.
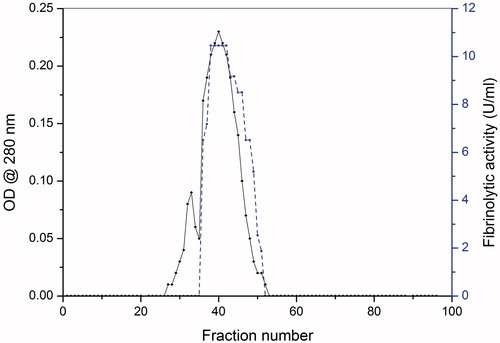
Table 1. Purification summary of xylarinase from Xylaria curta.
Figure 2. Determination of homogeneity, molecular mass and fibrinolytic activity of xylarinase. (a) SDS-PAGE analysis of purified xylarinase. Xylarinase resolved from MPLC, Sephacryl S-300 column was electrophoresed on 10% SDS gel. The gels were stained using silver staining method. (b) Determination of molecular weight by MALDI-TOF method.
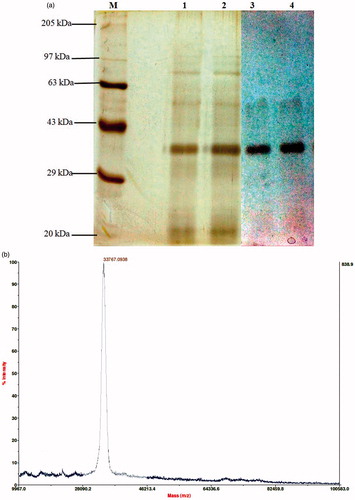
Table 2. N-terminal acid sequence of xylarinase and alignment with other enzymes.
Table 3. Effect of xylarinase on fibrinogen clotting time.
Table 4. Effect of xylarinase on coagulation parameters.
Figure 3. Fibrinolytic activity of xylarinase on plasminogen deficient plate by fibrin plate method. Fibrin plate was prepared by mixing fibrinogen with thrombin and agarose. Twenty microliters of xylarinase was dispensed into wells and incubated for 12 h at 37 °C.
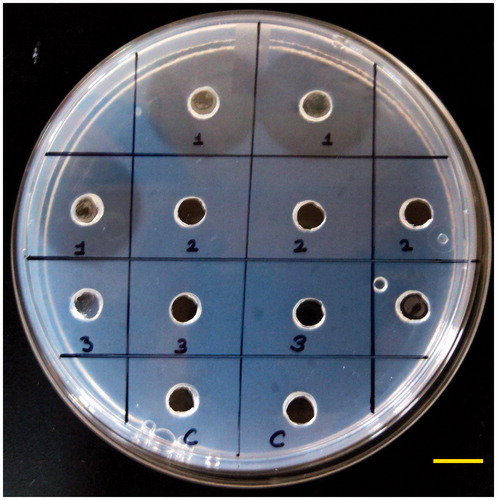
Figure 4. Degradation pattern of fibrinogen by xylarinase. Lane 1: fibrinogen, lanes 3–10: degradation products after 5, 10, 15, 30, 45, 60, 120 and 180 min incubation, respectively.
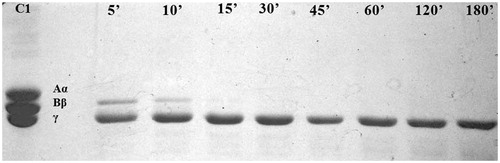
Figure 5. Effect of pH (a) and temperature (b) on fibrinolytic activity of xylarinase. Each value represents the mean ± SD for three determinations.
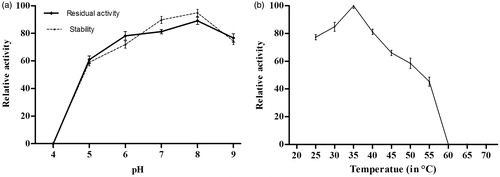
Figure 6. Effect of protease inhibitors (2 mM) (a) and metal ions (2 mM) (b) on xylarinase. The fibrinolytic activity in absence of protease inhibitors and metal ions were regarded as 100%. Each value represents the mean ± SD for three determinations.
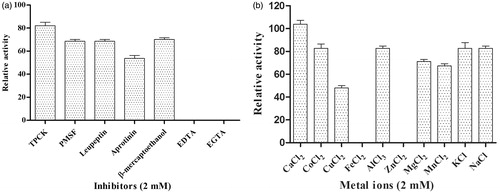
Figure 7. Lineweaver–Burk plot for the hydrolysis of fibrin by xylarinase, plasmin and streptokinase.
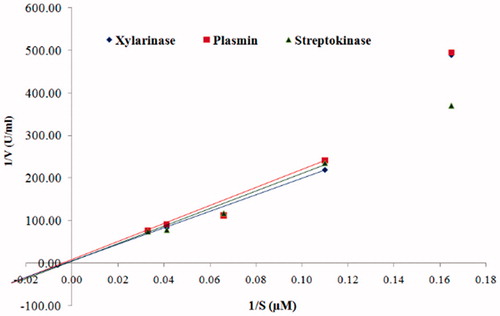
Figure 8. In vitro thrombolytic activity of xylarinase. The degradation of thrombus was observed by immersing the clot in various concentrations of xylarinase for 60 min. 1: 50 μg, 2: 40 μg, 3: 30 μg, 4: 20 μg, 5: 10 μg. C1 and C2: Control.
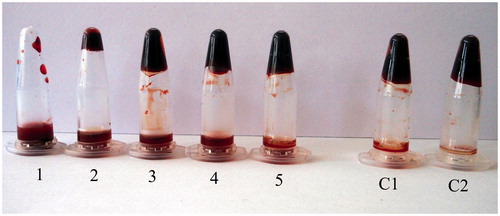
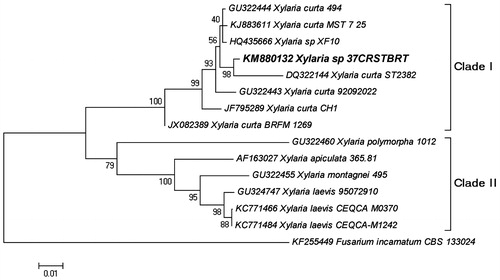
Figure 9. The Neighbor-Joining tree based on the ITS1-5.8S-ITS2 region. The optimal tree with the sum of branch length = 0.4305 is shown. The percentage of replicate trees in which the associated taxa clustered together in the bootstrap test (1000 replicates).