Figures & data
Figure 1 Flowchart of subjects in the study. Flowchart of the study. *Due to logistic reasons. COPD criteria are based on the GOLD guidelines: COPD is defined as the presence of postbronchodilator FEV1/FVC ratio < 0.70.
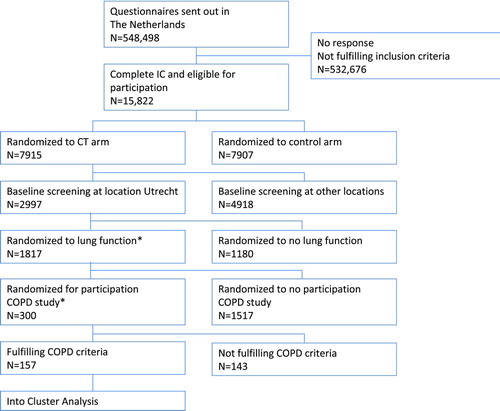
Figure 2 Dendrogram. Hierarchical cluster analysis by Ward's method resulted in a dendogram identifying 4 clusters.
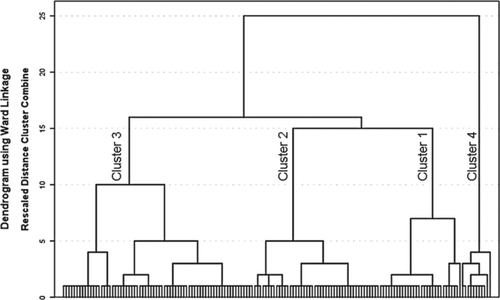
Table 1. Demographics and clinical characteristics of the total cohort and COPD clusters identified by factor and cluster analysis
Table 2. Description of the total cohort and COPD clusters identified by factor and cluster analysis
Table 3. Loadings of variables per factor