Figures & data
Figure 1. Flow chart depicting participant recruitment and study design.
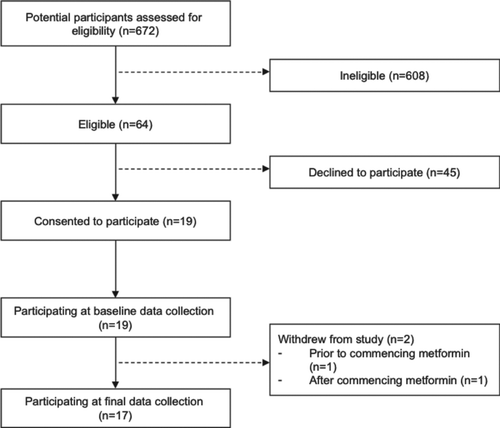
Table 1. Baseline characteristics of study participants
Figure 2. Change in St George's Respiratory Questionnaire total score. The dashed line shows change in the median score.
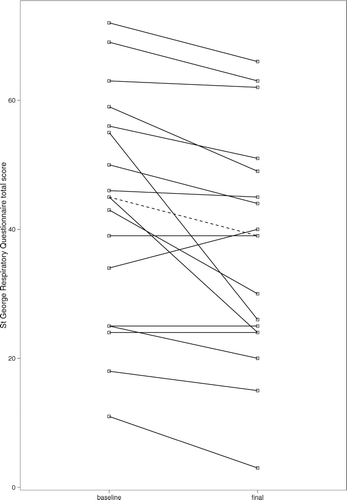
Table 2. Changes in health status and symptoms
Table 3. Changes in lung function, gas transfer and exhaled nitric oxide
Table 4. Changes in general and respiratory muscle strength
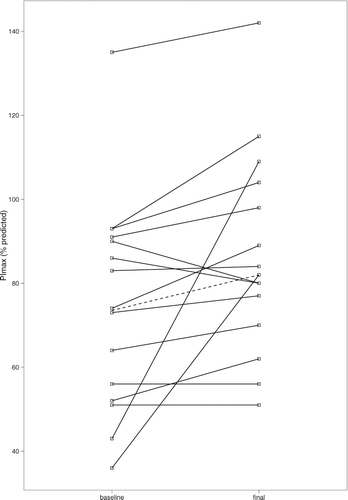
Figure 3. Changes in inspiratory mouth pressures (PImax). The dashed line shows change in median PImax.