Figures & data
Table 1. Immunoglobulin levels and autoantibodies in B2m+/+, B2m+/−, and B2m−/− mice following 4 weeks of mercury exposurea.
Table 2. Immunopathological changes in B2m+/+, B2m+/−, and B2m−/− mice following 4 weeks of mercury exposurea.
Figure 1. ANA and ANoA in HgCl2-exposed B2m+/+ and B2m−/− mice. Mice were injected with HgCl2 (40 µg in 100 µL PBS) twice per week for 4 weeks before determination of serum IgG ANoA by indirect immunofluorescence on HEp-2 cells. (A) Endpoint titer of IgG ANoA in B2m+/+ and B2m−/− mice. The geometric mean (and range) of IgG ANoA titers differed significantly between B2m−/− and B2m+/+ mice (340 [160–640] vs. 1540 [160–2560]; p < 0.025). (B) Fluorescence intensity of IgG ANA and ANoA in B2m+/+ (n = 9), B2m+/− (n = 8) and B2m−/− (n = 8) mice at a serum dilution of 1/100. ANoA autoantibodies (as mean ± SEM) differed significantly between B2m−/− (n = 8) and B2m+/+ (n = 9) mice (1.3 (± 1.1) vs. 2.8 (± 0.56); p = 0.0027).
![Figure 1. ANA and ANoA in HgCl2-exposed B2m+/+ and B2m−/− mice. Mice were injected with HgCl2 (40 µg in 100 µL PBS) twice per week for 4 weeks before determination of serum IgG ANoA by indirect immunofluorescence on HEp-2 cells. (A) Endpoint titer of IgG ANoA in B2m+/+ and B2m−/− mice. The geometric mean (and range) of IgG ANoA titers differed significantly between B2m−/− and B2m+/+ mice (340 [160–640] vs. 1540 [160–2560]; p < 0.025). (B) Fluorescence intensity of IgG ANA and ANoA in B2m+/+ (n = 9), B2m+/− (n = 8) and B2m−/− (n = 8) mice at a serum dilution of 1/100. ANoA autoantibodies (as mean ± SEM) differed significantly between B2m−/− (n = 8) and B2m+/+ (n = 9) mice (1.3 (± 1.1) vs. 2.8 (± 0.56); p = 0.0027).](/cms/asset/78a05263-2cf0-47f9-888d-922e9162f6e0/iimt_a_583614_f0001_b.gif)
Table 3. IgG subclass of anti-chromatin antibodies in B2m+/+and B2m−/− mice following 4 weeks of mercury exposure.
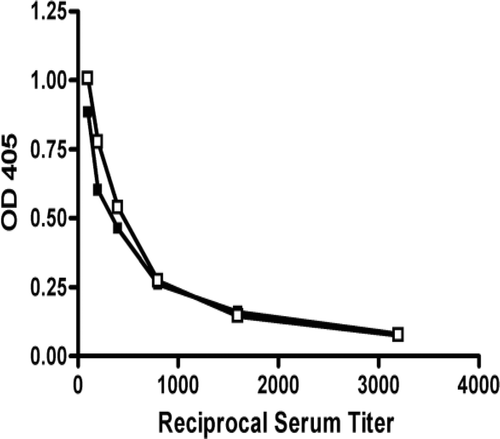
Figure 2. Titration of IgG anti-chromatin antibodies in HgCl2-exposed B2m+/+ and B2m−/− mice. Mice were injected with HgCl2 (40 µg in 100 µL PBS) twice per week for 4 weeks before determination of serum IgG anti-chromatin antibodies using ELISA. Titration consisted of serial 2-fold dilution of individual sera from 1/100 to 1/3200. OD405 values represent the geometric mean at each serum dilution for B2m+/+ (n = 9) and B2m−/− (n = 6) mice. B2m+/+ ▪ B2m−/− ▪.

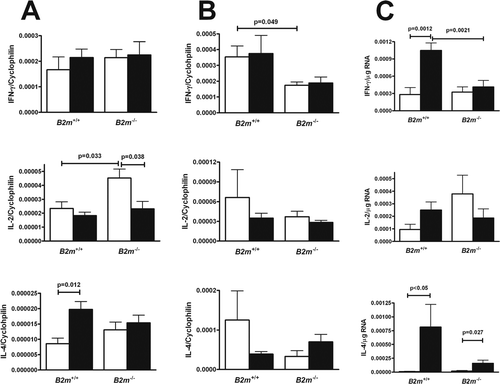
Figure 3. IFNγ, IL-2, and IL-4 expression in the (A) spleen, (B) draining lymph node, and (C) skin of HgCl2-exposed B2m+/+ and B2m−/− mice. Mice were injected subcutaneously with 40 µg HgCl2 in phosphate-buffered saline (PBS) (solid bars) or with PBS alone (open bars) for 2 weeks. Total RNA was prepared and quantitative real-time polymerase chain reaction was performed on reverse-transcribed RNA. The mRNA level was normalized using cyclophilin A for spleen and lymph node. For skin samples, cytokine mRNA levels were related to total RNA concentration. Values represent the mean and SEM of 4 mice per group.
