Figures & data
Figure 1. Administration of ANE impaired thymocyte IL-2 production. Thymocytes (5 × 10⁶ cells/ml) isolated from different groups treated with or without ANE in vivo were cultured ex vivo and stimulated with PMA + ionomycin for 24 h. (a) Metabolic activity of the thymic cells was measured by MTT assay. (b) Concentrations of IL-2 in culture supernatants were measured by ELISA. Data are expressed as mean (±SE) of quadruplicate cultures. Results are representative of three independent experiments. *Value significantly different compared to VH group at p < 0.05.
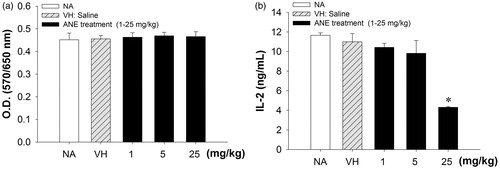
Table 1. The in vivo effect of ANE on body weight and on thymus weight and cellularity.
Figure 2. ANE directly suppressed IL-2 production by thymocytes. Thymocytes (5 × 10⁶ cells/ml) were left untreated (NA) or treated with ANE (1–40 µg/ml) for 30 min and then stimulated with PMA + ionomycin for 24 h. (a) Metabolic activity of the thymic cells was measured by MTT assay. (b) Production of IL-2 as measured by ELISA. Data are expressed as mean (±SE) of quadruplicate cultures. Results are representative of three independent experiments. *Value significantly different compared to VH group at p < 0.05.
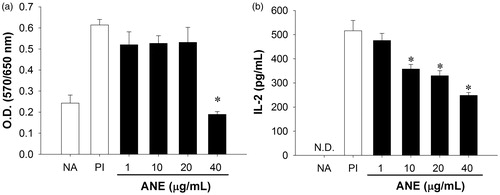
Figure 3. ANE-induced thymocyte apoptosis. Thymocytes were left untreated (NA) or treated with ANE (1–40 µg/ml) for 12 h, and then fixed with ethanol. The single cell fluorescence of 5000 cells per sample was then measured by flow cytometry. (a) Data presented as a proportion of apoptotic cells, defined as sub-G0/G1-phase cells with hypodiploid DNA content. (b) Portion of TUNEL+ cells. (c) Representative histograms of TUNEL analyses on NA and ANE (20–40 μg/ml)-treated cells. Data are expressed as mean (±SE) of quadruplicate cultures. Results are representative of three independent experiments. *Value significantly different compared to VH group at p < 0.05.
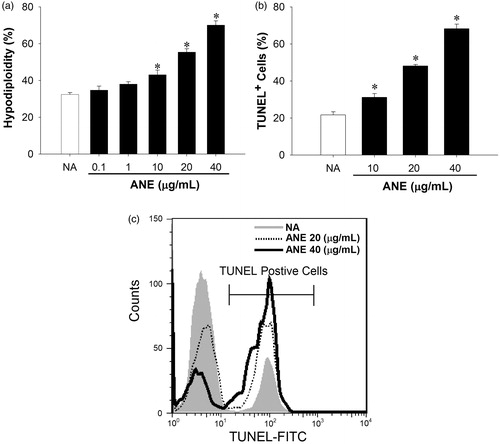
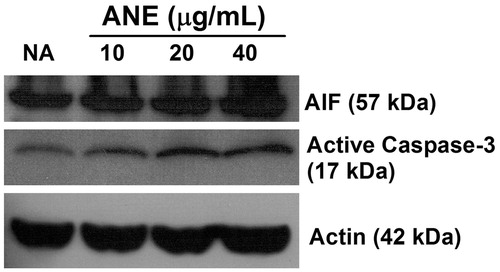
Figure 4. Induction of apoptosis-inducing factor (AIF) and active caspase-3 by ANE. Thymocytes were left untreated (NA) or treated with ANE (10–40 μg/ml) for 3 h. The cells were then lysed and amounts of apoptosis-inducing factor (AIF) and the active form of caspase-3 in the cytosolic extracts were measured using Western blotting. The level of actin was used as a loading control. The data shown are representative of three independent experiments.