Figures & data
Figure 1. (A) Absolute total cell counts, as well as (B–D) Total CD4+ and CD8+ T-cells and B-cells from brachial LN of mice treated with vehicle, cimetidine, metformin, abacavir, amoxicillin, ofloxacin, or sulfamethoxazole (SMX). **p < 0.01 or ***p < 0.001; n = 10. Data were combined from two independent experiments with five mice/group/experiment. Each point represents one individual value. All data are expressed as mean ± SEM.
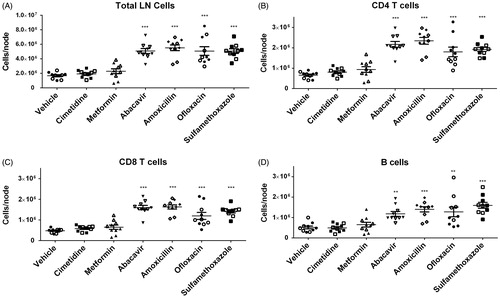
Figure 2. (A) Representative histograms showing the up-regulation of CCR7 surface expression on CD4 + and CD8+ cells following amoxicillin treatment. (B) MFI of CCR7 for CD4+ and CD8+ T-cells. ***p < 0.001; n = 10. Data were combined from two independent experiments with five mice/group/experiment. Each point represents one individual value. All data are expressed as mean ± SEM.
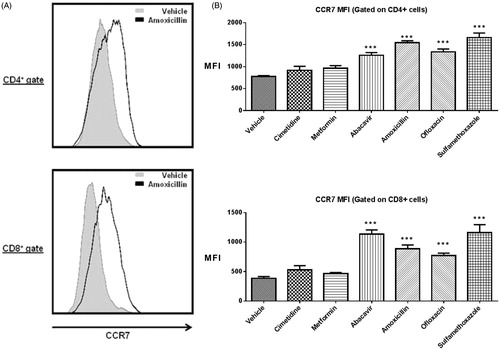
Figure 3. (A) Representative dot plots depicting CD44 and CD62L surface staining in DLN following amoxicillin treatment (100 mg/kg). Percentages of CD44lowCD62Llow sub-populations among (B) CD4+ and (C) CD8+ cells isolated from DLN of vehicle and drug-treated mice. *p < 0.05, **p < 0.01, and ***p < 0.001; n = 10. Data were combined from two independent experiments with five mice/group/experiment. Each point represents one individual value. All data are expressed as mean ± SEM.
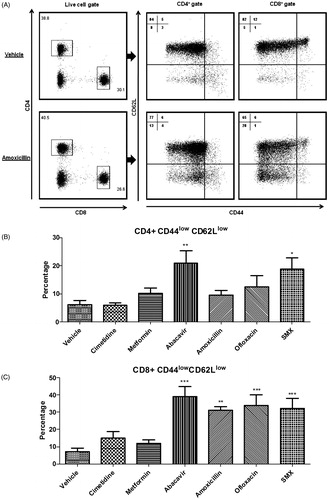
Figure 4. (A) Representative dot-plots of Ki67 staining. (B) Percentage of Ki67+ cells within CD4+, CD8+, and B-cell sub-populations from the DLN of mice administered vehicle, abacavir, amoxicillin, cimetidine, or metformin. *p < 0.05; n = 5. All data are expressed as mean ± SEM.
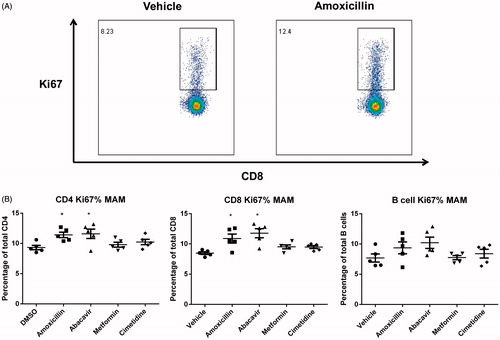
Figure 5. Example of dot-plots. (A) CD3+ versus CD19+ cells. (B) CD44 and CD62L expression on CD8+ cells. (C) Percentage of T-cells (CD3+) and B-cells (CD19+). (D) Percentage of CD8+ cells expressing CD44lowCD62Llow and CCR7 mean fluorescence intensity (MFI) in the draining LN following drug treatment in the MDAM and LLNA. (E) Percentage of Ki67+ cells within CD4+, CD8+, and B-lymphocyte sub-populations from the DLN of mice treated with DNFB. *p < 0.05 or ***p < 0.001 compared to vehicle control group; n = 5. Values shown are mean ± SEM.
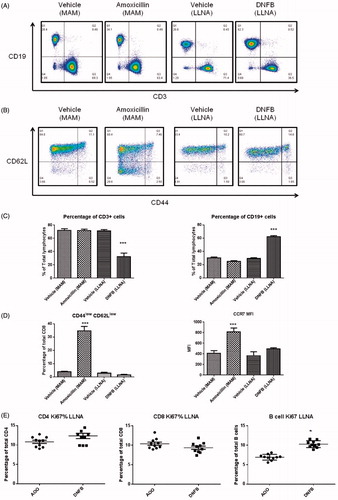
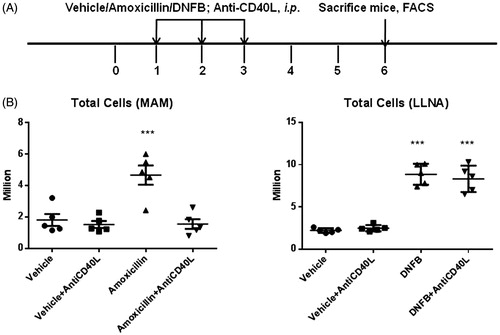
Figure 6. (A) Experimental design for anti-CD40L experiments. Mice were administered vehicle, amoxicillin, or DNFB in the presence or absence of anti-CD40L antibody (500 µg on Days 1, 2, and 3). (B) Effects of anti-CD40L treatment on total cell count in DLN in the MDAM and LLNA. ***p < 0.001; n = 5. Values shown are mean ± SEM.