
Figures & data
Figure 1. Portrait of Henk Verbiest (1909–1997), professor of neurosurgery 1963–1980. Oil on canvas, 144 x 79 cm. Painted in 1982 by E.T.H. Visser (1919–2007). The portrait was offered to Verbiest in 1983 by his co-workers at his farewell as professor. Now in Collection of the Utrecht University Museum, inv. no. UG-5027. The Utrecht University Medical Center. By permission.
Figure 2. Sagittal (left) and axial (right) MR images showing severe spinal stenosis (10 mm2) with concomitant degenerative spondylolisthesis.
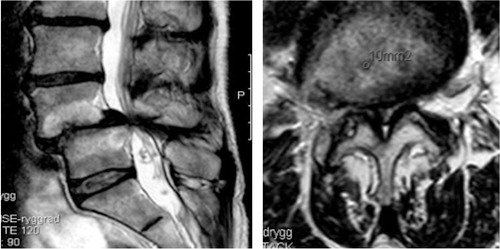
Figure 3. Lateral recess stenosis (left), foraminal stenosis (center) and central spinal stenosis (right).
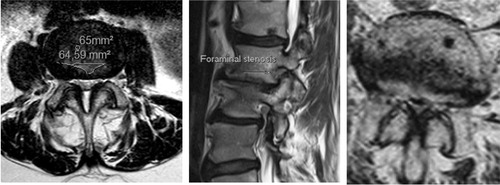
Figure 4. Sagittal MR image (left) and a radiograph (right) showing severely degenerated lumbar spine. Observe severe disc degenerations, facet joint hypertrophy with lateral recess stenosis and degenerative scoliosis in addition to the ankylotic and spondylolisthetic L5–S1 segment.
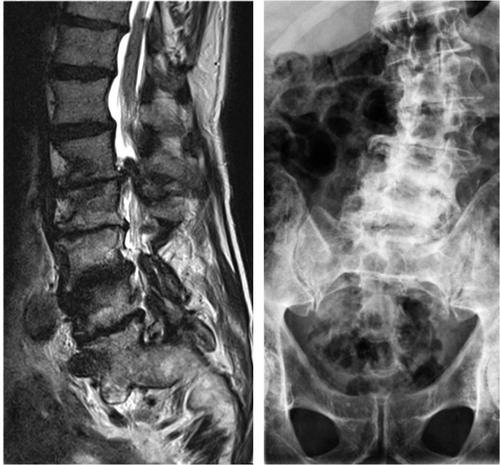
Figure 5. Sagittal view of the spine. A drawing from 20th US edition of Gray`s Anatomy of the Human Body (left). This edition was originally published in 1918 and is now in the public domain. For comparison is a MR image of the spine showing mild degenerative changes in the lower lumbar spine (right).
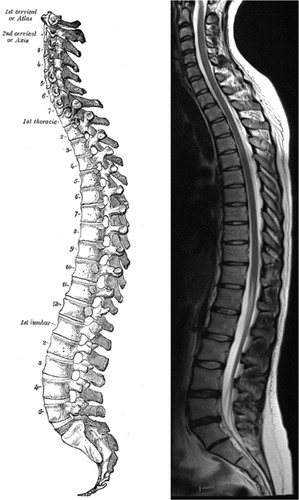
Figure 6. A sagittal view of the spinal canal exposing the structures that delineate the spinal canal and in the degenerative process can impinge on the dural sac and nerve roots. A drawing from 20th US edition of Gray`s Anatomy of the Human Body. This edition was originally published in 1918 and is now in the public domain.
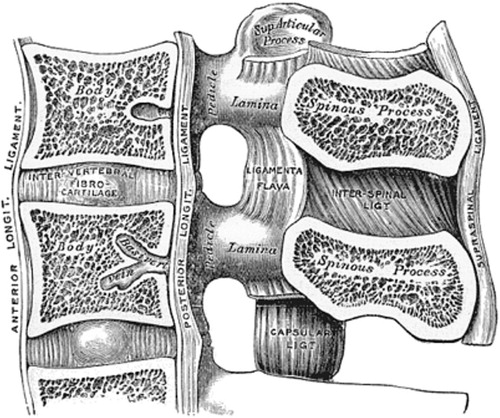
Figure 7. A trefoil spinal canal can predispose for lateral recess stenosis.
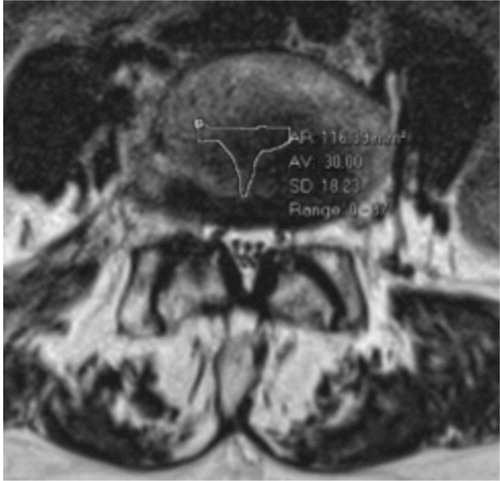
Table 1. The etiologic classification of spinal stenosis according to Arnoldi et al. (Citation1976)
Figure 8. Myelography of the lumbar spine revealing spinal stenosis (arrows).
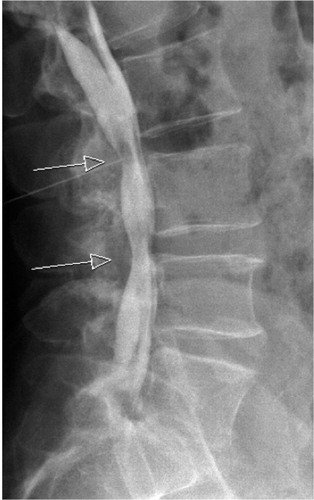
Figure 9. CT myelography of the spine revealing spinal stenosis at the L4–L5 level.
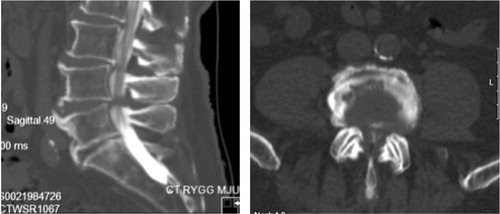
Figure 10. On the supine sagittal MRI, the degenerative spondylolisthesis is subtle but on the standing lateral radiograph the slip increases markedly and the disk height decreases simultaneously. Note the fluid signal in the facet joints on the axial MRI indicating potential for pathological segmental movement. The patient had left sided radiating pain, corresponding to the L5 nerve root and reported negligible back pain.
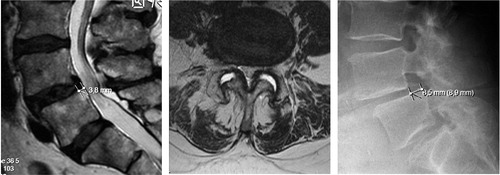
Figure 11. 72-year old woman with DS and scoliosis as well as fluid in the facet joints before she was operated with decompression only in 2002, preoperative MRI (left). She reported excellent clinical outcome. In 2014 she had an MRI of the whole spine as she had pain in the thoracic spine and pancreatic cancer. The DS and the scoliosis had not progressed despite the lack of stabilizing surgery (right).
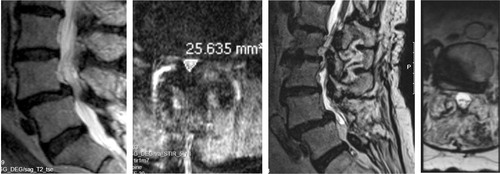
Figure 12. A Kerrison rongeur and a chisel are essential tools for performing laminectomy.
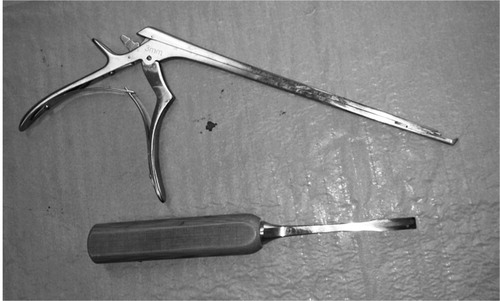
Figure 13. Post operative radiograph, of the lumbar spine showing pedicle screw fixation of the L4-L5 segment.
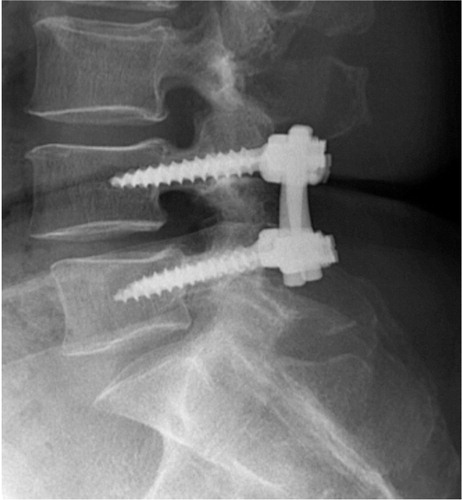
Figure 14. Histograms showing the one-year outcome for back pain (top) and leg pain (bottom). Patients more or less pain free (VAS <10mm) are located to the left of the vertical line.
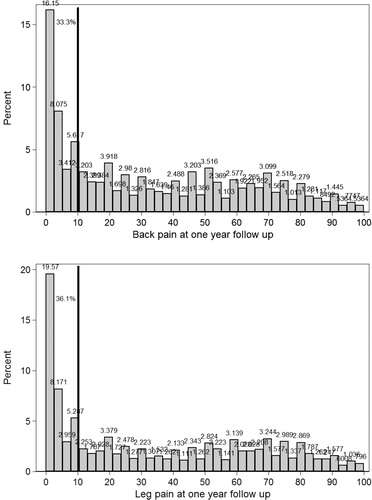
Figure 15. A histogram showing the one-year outcome in terms of the EQ-5D. The majority of patients estimate EQ-5D score > 0.5 (right side of the vertical line).
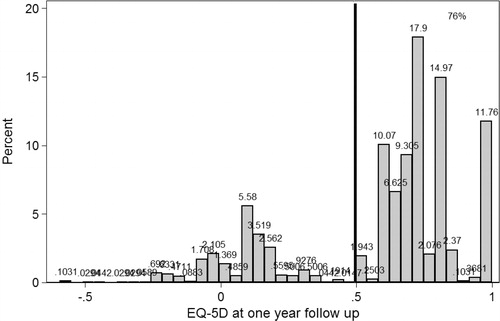
Figure 16. Schematic overview of analyses performed to account for selection bias due to missing or drop out patients. * For baseline degenerative spine data, see: http://4s.nu/Kopia_av_patientsida/formular/100301_ver3_LR_Basuppgifter.pdf
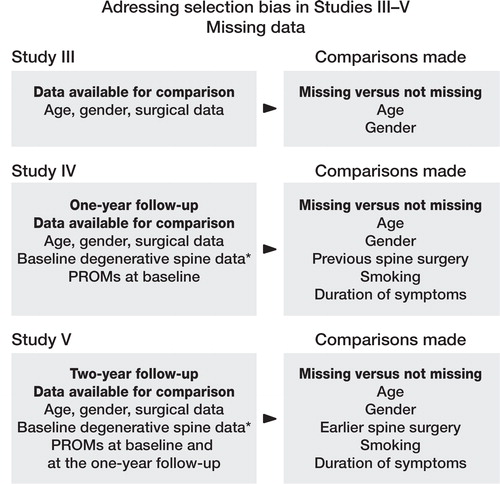
Table 2. Duration of leg pain and outcome measures at the one-year follow up. Values are number of cases, mean (SD)
Table 3. Patient satisfaction at the one-year follow-up in relation to pre- and postoperative HRQoL, functional status, and pain
Table 4. Preoperative values for LSS subtypes according to gender. Mean values are presented with 95% CI in parenthesis
Figure 17. A box plot showing the association between leg and back pain and self-estimated walking distances in LSS. It is evident from this box plot that with increased pain the self-estimated walking distance deteriorates.
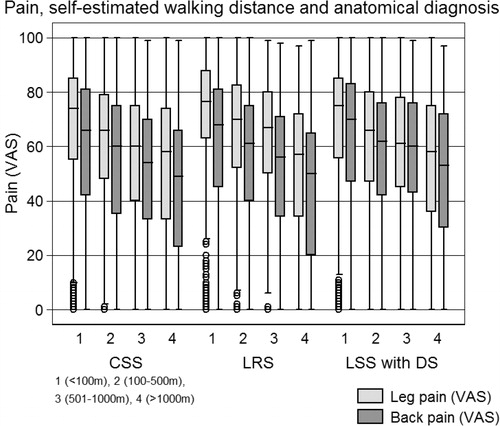
Table 5. Simple and multivariate linear regression analysis of outcome in terms of the Oswestry disability index, the physical component summary and the mental component summary according to pain predominance and treatment, decompression and decompression and fusion. Values are outcome (95%CI) and p-value
Table 6. The hazard ratios for patients having leg or back pain ≥ 10 on the VAS scale (risk for increased pain) and the hazard ratios for estimating a ≥ 0.5 EQ–5D score (risk for better HRQoL) at the one- and two-year follow–ups
Figure 18. The percentage of satisfied patients at the one-year follow-up in 16 different different boxes according to the relationship between preoperative leg and back pain (VAS).
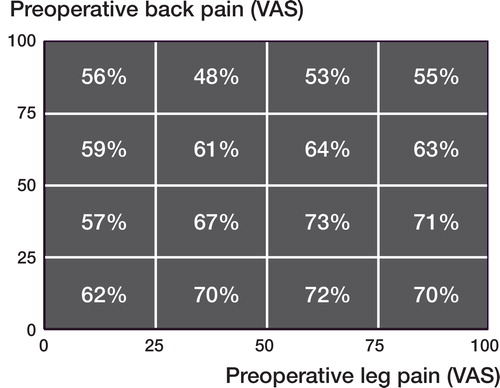
Figure 19. The outcome in terms of back pain according to pain predominance is depicted. Note that the absolute outcome values for back pain are similar in the DF and D groups but the change (improvement) in the back pain is more pronounced in the DF group compared to the D group. In the predominant leg pain group the baseline values for back pain in the patients decompressed only are significantly lower than that of the DF group.
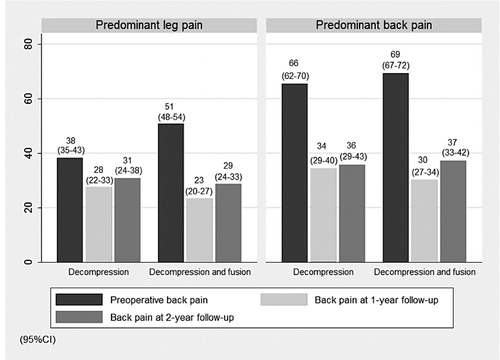
Table 7. Baseline and outcome data for patient reported outcome measures
Table 8. Methodology criteria for critically appraising the quality of a register study