Figures & data
Figure 1. PRISMA flow chart of both reviews. Details of the 14 PF combinations can be found in Table 1.
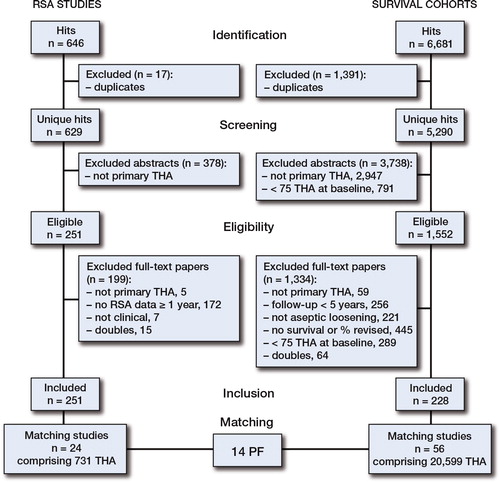
Table 1. Details of prosthesis and fixation (PF) combinations
Figure 2. Scatter plot showing the subsidence at 2 years (in mm) and revision rate for aseptic loosening of the femoral stem at 10 years (percentage), categorized according to design concept (i.e. shape-closed, force-closed, uncemented).
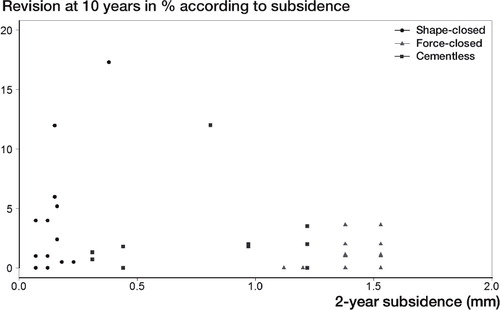
Figure 3. Scatter plot showing the association between 2-year subsidence (in mm) and revision rate for aseptic loosening of the shape-closed femoral stem at 10 years (percentage). The colored lines are derived from weighted regression according to match quality, survival study quality, and RSA quality (the coefficients and 95% CIs are presented in Table 2).
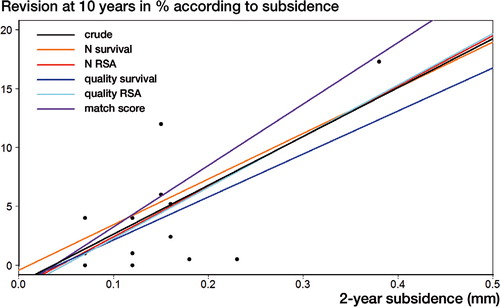
Table 2. Association between 2-year subsidence of shape-closed femoral stems and revision rate for aseptic loosening at 10 years. Increase in 10-year revision rate (%) for each 0.1-mm increase in subsidence at 2 years. In the crude analysis (unadjusted), 4.2% (95% CI: 1.3–7.1; p < 0.05) was added to the 10-year revision rate for every 0.1-mm increase in subsidence at 2 years
Figure 4. Line chart of the pooled subsidence (in mm) up to 2 years, according to design concept (i.e. shape-closed, force-closed, uncemented). The standard errors were 0.05 mm and 1 mm (force-closed), 0.08 mm and 0.07 mm (uncemented), and 0.01 mm and 0.01 mm (shape-closed) at 1 and 2 years, respectively.
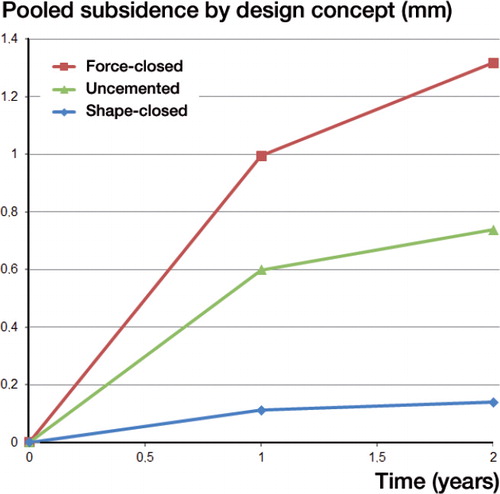
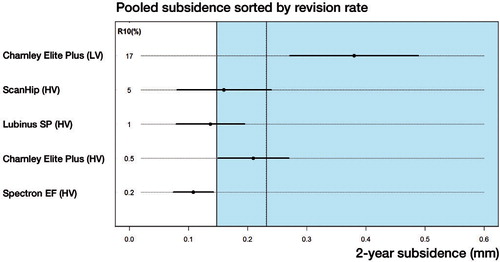
Figure 5. Scatter plot showing the 2-year subsidence and revision rate of shape-closed femoral stems for aseptic loosening at 10 years. The threshold of 0.15 mm for acceptable subsidence is shown. The threshold of 0.23 mm for unacceptable subsidence could be defined less precisely and is also shown. Adoption of the NICE criteria (10% revision at 10 years) did not alter these thresholds.
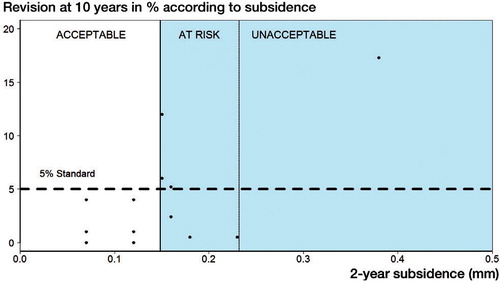
Figure 6. Dot chart showing the pooled 2-year subsidence of shape-closed femoral stems ranked by the pooled 10-year revision rate for each PF combination. The threshold of 0.15 mm for acceptable subsidence is shown and the less precisely definable threshold for unacceptable subsidence (0.23) is also shown.