Figures & data
Figure 1. Bone remodeling in a basic multicellular unit.
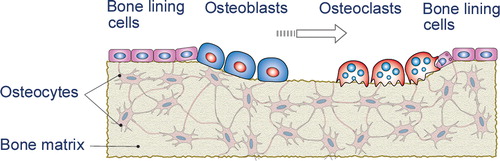
Figure 2. CT image demonstrating the trabeculae in the proximal femur.
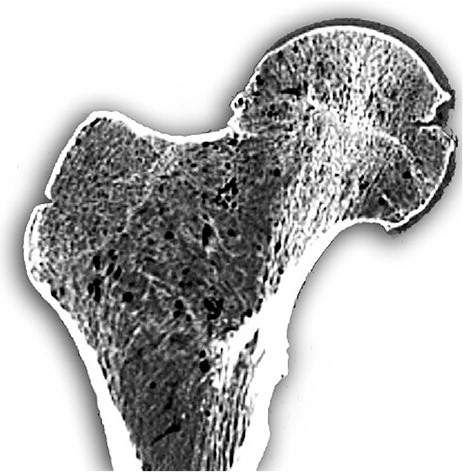
Figure 3. a. Single leg stance. The grey arrow represents the joint reaction force and the red arrows represent the abductor resultant and bodyweight.
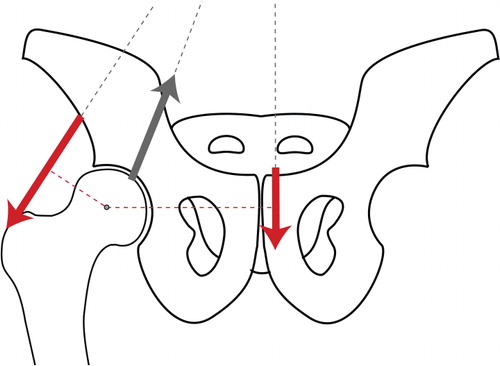
b. Anterior loading of the femoral head lead to an internally directed torque.
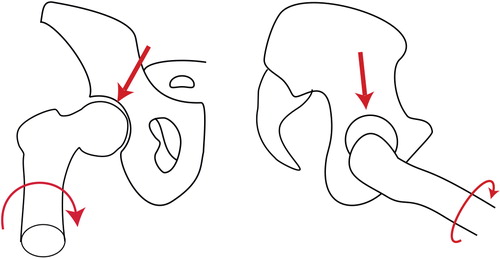
Figure 4. a. Displaced femoral neck fracture.
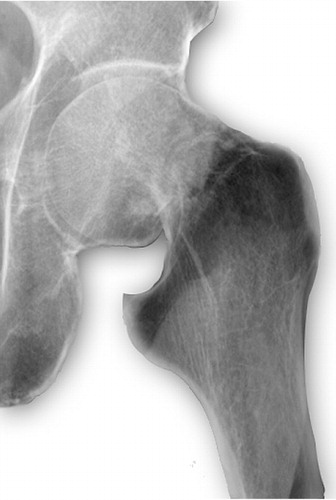
b. Undisplaced femoral neck fracture.
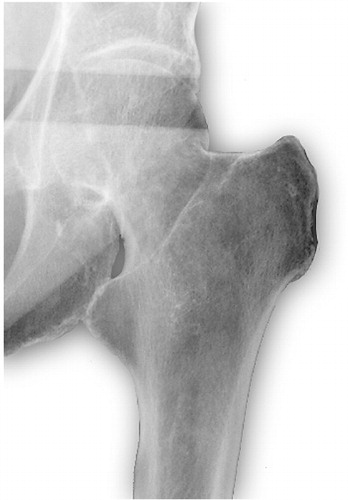
Figure 5. Subcapital, transcervical and lateral fractures
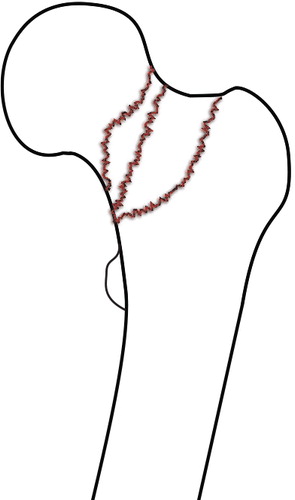
Figure 6. Schematic illustration of the blood supply to the femoral head
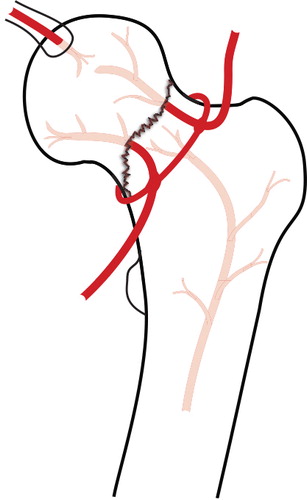
Figure 7. Hemiarthroplasty.
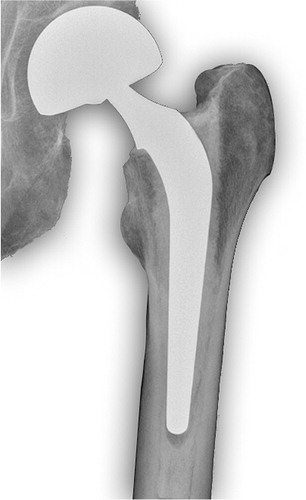
Figure 8. Multiple screws.
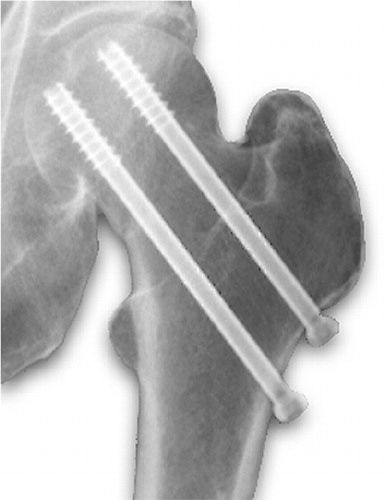
Figure 9. Gliding hip screw.
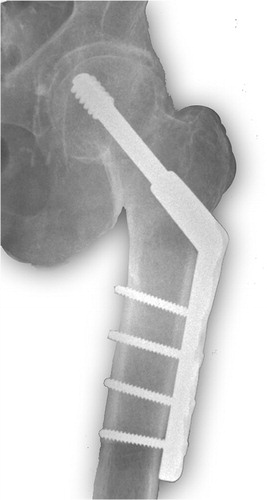
Figure 10. Load–deformation curve.
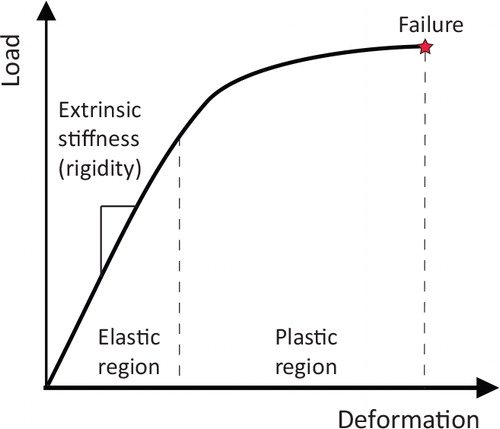
Figure 11. Stress–strain curve.
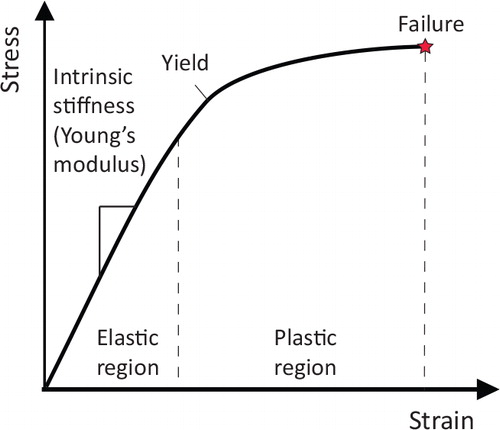
Table 1. Demographics
Figure 12. Medium (left) and large (right) 4GCFs.
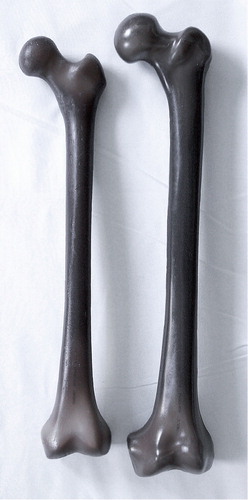
Figure 13. Fracture line.
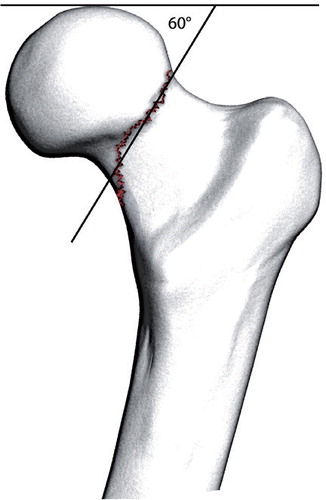
Figure 14. Three cannulated screws (a) and three cannulated screws and a locking plate (b).
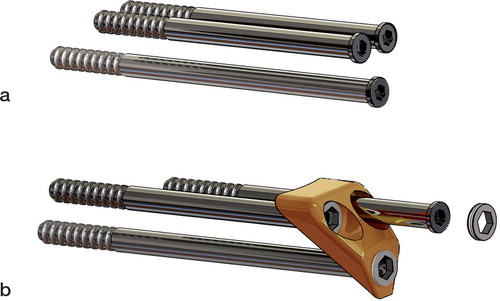
Figure 15. Schematic illustration of the hip jig (left) and picture of the hip simulator (right).
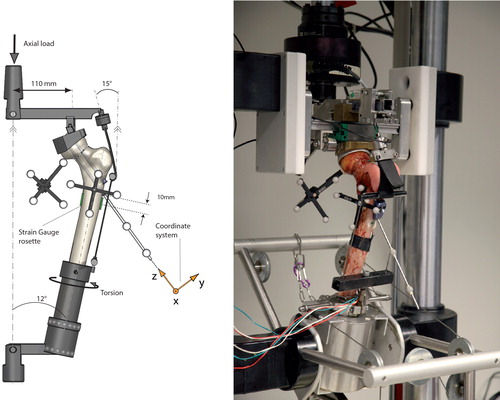
Figure 16. Cyclic load regimes.
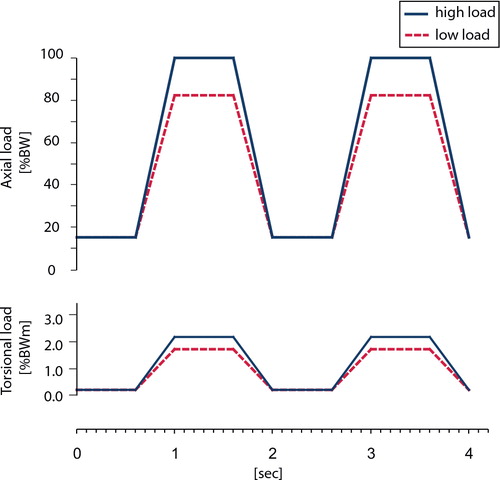
Figure 17. Polaris Spectra.
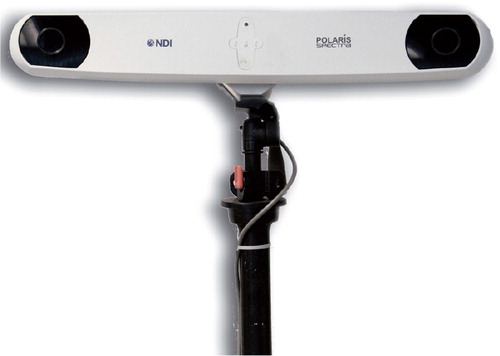
Figure 18. Coordinate systems
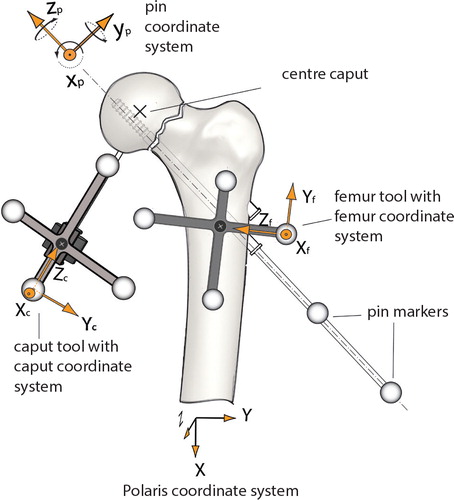
Figure 19. A typical example of plastic deformation of the proximal femur following cyclic loading.
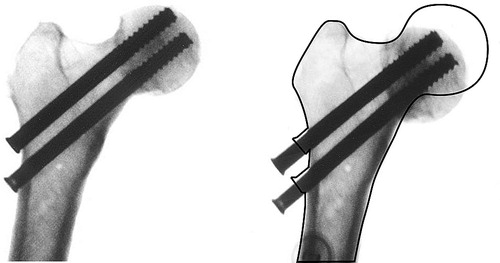
Figure 20. Plastic deformation of each single, unloaded femur during 20.000 cycles, note new loading regime at 10.000 cycles. Measurements every 100 cycles. Interpolation line when missing data points. Femoral pairs in same color. Black dots at point of failure.
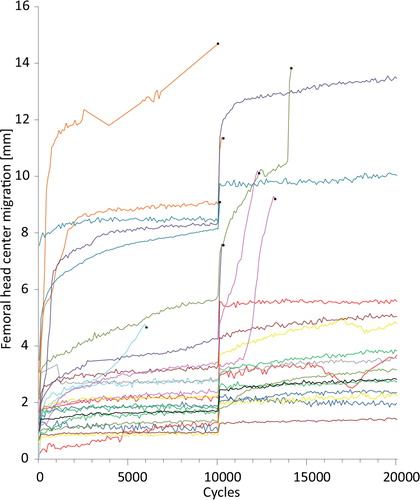
Figure 21. a. Fracture down the medial neck. b. Fracture with screw-hole involvement.
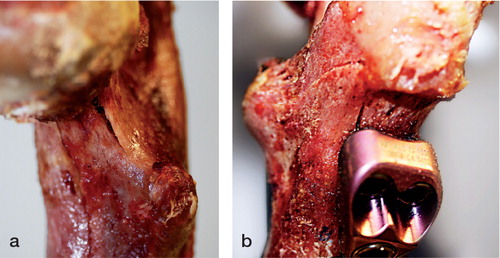
Figure 22. Average micromotion in the locking plate group and in the screws group decomposed into three translations and three rotations.
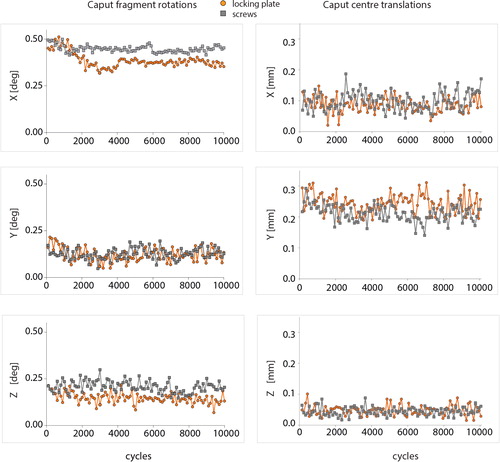
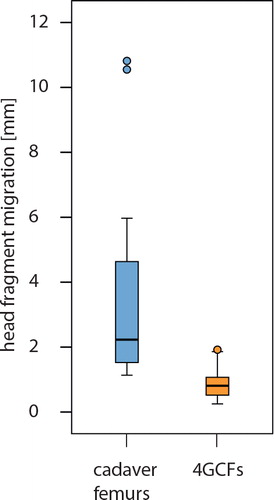
Figure 23. Head fragment migration