Figures & data
Figure 1. Development of a workflow for gene expression profiling of human pluripotent stem cell (hPSC) micro samples. Samples from human embryonic stem cell (hESC) or human induced pluripotent stem cell (hiPSC) cultures were collected from (A) colony biopsy, scraped and aspirated using a pipette tip from monolayers covered with PBS; or from (B) enzymatically dissociated cells, washed, and spun down in PBS. (C) Uniform embryoid bodies (EBs) were formed by forced aggregation of dissociated cells in AggreWell400 plates. Individual EBs were washed in PBS and transferred to lysis buffer containing proteinase K and DNAse. (D1) Cell lysis and gDNA clearance was performed using a 3-step temperature protocol in a thermocycler. (D2) 4 µl of the lysate was used in a reverse transcription (RT) reaction. (D3) For pre-amplification (Pre-Amp) of specific targets, 5 µl of cDNA was used in a 50 µl Pre-Amp reaction containing 100 distinct primer pairs. (D4) Enriched samples were diluted 1:5 to 1:10 in ddH2O, and 1 µl of diluted sample was used in subsequent SYBR-Green quantitative PCR (qPCR) reactions.
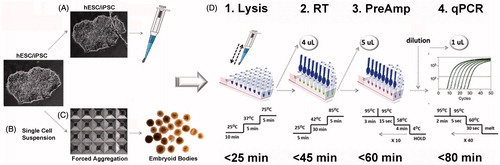
Figure 2. Evaluation of the workflow. Key to pre-amplification (Pre-Amp) is to retain the specific gene expression profile of the original cDNA sample. (A) Illustration of the analytical deduction of expected (theoretical) ΔCq between starting cDNA material and Pre-Amp sample for any given target. 10 cycles of Pre-Amp results in ∼1000 fold enrichment of specific targets: For instance 5 µl of cDNA with 1 copy/µl result in 5,000 copies/Pre-Amp reaction. Considering a dilution of 1:5, a 20 fold increase in targets (20 copies/µl) is achieved, representing a shift in about 4.3 Cq values. Thus, an unbiased Pre-Amp reaction generates a ΔCq value close to the theoretical value of 4.3. The difference (ΔΔCq) between experimental (ΔCq) and theoretical Cq (4.3) results in a value equal to zero. A tolerance range of ± 0.75 Cq is applied. (B) Expression data were obtained from day 15 EBs using the PrimePCR human embryonic stem cell (hESC) panel. Pre-Amp values reveal an excellent correlation (R2 = 0.994) to corresponding cDNA material for all 57 expressed targets. (C) Bias assessment for the Pre-Amp reaction compared to starting cDNA (ΔΔCq) displays minimal bias, within the tolerance range of ± 0.75 Cq. (D) Performing three independent Pre-Amp and quantitative PCR (qPCR) reactions from the same cDNA sample proves excellent reproducibility for expression data for all targets (target numbers as listed in Supplemental Table 1). 96.5% of targets (55 out of 57) are within the tolerance range of +/− 0.75 Cq. The average standard deviation of 3 independent Pre-amp experiments is ±0.09 ΔΔCq (0.02–0.17). All targets with Cq ≤ 32 in starting cDNA samples were analyzed.
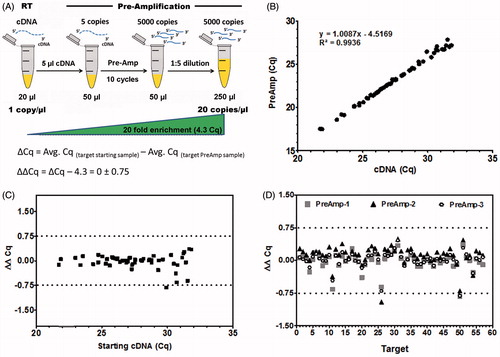
Figure 3. Monitoring lineage differentiation in embryoid bodies (EBs). Gene expression profiling of EBs using random differentiation by FBS for 7 days (A–F) or specific lineage induction using defined culture conditions (G–H). Graphs show normalized gene expression data for Pre-Amp (PA) and corresponding cDNA samples of randomly differentiating EBs compared to undifferentiated human embryonic stem cell (hESC) (A, C, E). Down-regulated or repressed pluripotency markers (A) indicate extensive differentiation of cells. Predominantly mesodermal markers are up-regulated (E). When comparing Pre-Amp and cDNA sample, 45 out of 47 targets (95.7%) show excellent correlation of expression data, within the fold change range of ± 2 (B, D, F). Endoglin (ENG) show up-regulation of expression in both samples, but divergent levels, most likely due to low abundance (Cq = 31.5) of transcripts in the CA1 reference sample. Specific lineage induction by serum free culture of EBs supplemented with BMP4, activin A, and bFGF were analyzed at days 7, 14, and 21 using Pre-Amp samples (G–I). Data demonstrate temporal regulation of early ectodermal (G) and early mesodermal lineages (H) indicated by a temporal regulation of specific markers and progressive loss of pluripotent cells (I).
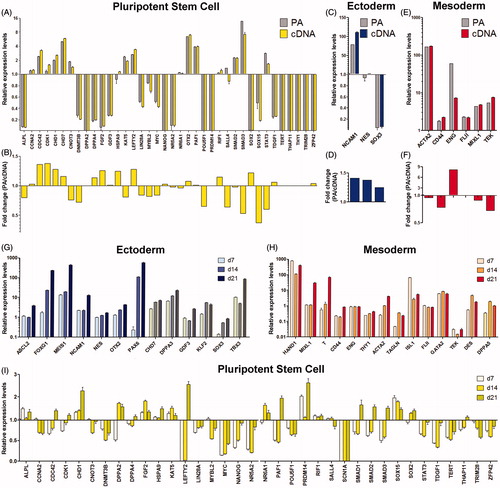
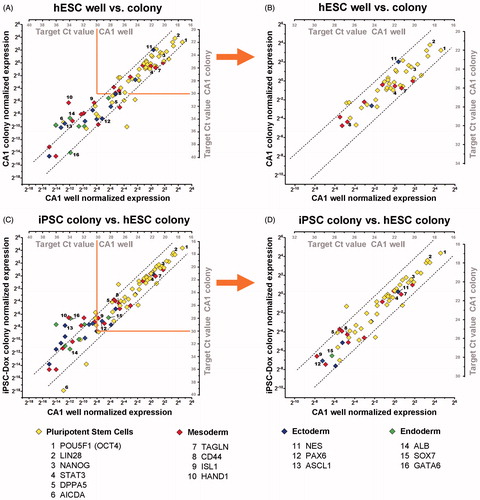
Figure 4. Analyzing hPSC cultures at a micro sample format. Graphs show a comparison of gene expression data obtained by pre-amplification (Pre-Amp) analysis from a small colony biopsy of CA1 (∼1,000 cells) vs. a dissociated CA1 culture sample (∼50,000 cells) (A, B), and an iPSC colony biopsy vs. CA1 (C, D). Normalized gene-expression data for each detected target are plotted on x1, y1 axes. The corresponding Cq values for each target are shown on x2, y2 axes. Dotted lines indicate a fold-change range of ±3.68 (21 + 20.75; qPCR error range + Pre-Amp tolerance range). Selected targets for all germ layers are indicated. (A) Comparison of two representative samples of CA1 cultures isolated and processed separately; show strongly correlating Pre-Amp gene expression data, for targets with Cq ≤ 30. (B) Reduced correlation of expression data are observed with Pre-Amp Cq > 30 (single copy detection range). (C) Comparison of a representative iPSC colony biopsy at the first passage (P1) after initial isolation, reveal a highly comparable expression profile, especially of pluripotency markers, compared to CA1. (D) Targets with Cq < 30 show strongly correlating gene expression data between the two analyzed samples. The workflow allows accurate gene expression profiling at earliest stages of reprogramming for quality control and colony selection.