Figures & data
Table 1. Body weight (BW) and weights of the testis, epididymis, seminal vesicle, liver, spleen, kidney, adrenal gland, and brain in mice after Citrus limon (C. limon) treatment and following treatment withdrawal.
Table 2. Fertility of male mice after treatment with C. limon (1000 mg/kg BW/days) or 1% Tween-80.
Figure 1. PAS–haematoxylin stained sections of mouse testis. (A) Control to show normal appearance of the seminiferous tubules. (B) After Citrus limon (C. limon) treatment, 500 mg/kg body weight/day for 35 days and sacrificed 24 hours after the last treatment to show loosening of germinal epithelium in the seminiferous tubules. (C) After the same treatment as shown in (B) to show exfoliation of germ cells in the lumen of a tubule. (D) After the same treatment as shown in (B). Note marginal condensation of chromatin in round spermatids (arrow) in a seminiferous tubule and appearance of intraepithelial vacuoles (broken arrows) in the tubules. (E) After C. limon treatment, 1000 mg/kg body weight/day for 35 days and sacrificed 24 hours after the last treatment. Note mixing of spermatids of different stages of spermatogenesis in a seminiferous tubule; steps 8, 9, and 10 spermatids are seen in the same tubule and an intraepithelial vacuole (broken arrow) is also seen in the tubule. (F) After the same treatment as shown in (E) to show occurrence of giant cells (arrow) containing 9 nuclei of round spermatids in the epithelium of a seminiferous tubule. (G) After the same treatment as shown in (E) to show severe degenerative changes in the seminiferous tubules. The tubule in the centre is lined by Sertoli cells and a few germ cells. (H) After C. limon treatment, 1,000 mg/kg body weight/day for 35 days and sacrificed 56 days after treatment withdrawal to show normal appearance of the seminiferous tubules (cf. part A). Scale bar = 50 μm.
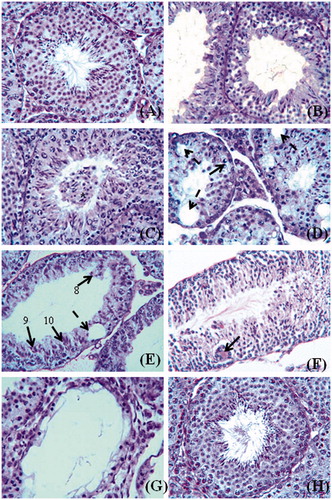
Table 3. Motility, viability, and number of spermatozoa in cauda epididymidis of mice after Citrus limon (C. limon) treatment and following treatment withdrawal.
Table 4. Diameter of seminiferous tubules, height of germinal epithelium, corrected count of germ cells in stage VII seminiferous tubules, and percentage of affected seminiferous tubules in mice testes after Citrus limon (C. limon) treatment and following treatment withdrawal.
Figure 2. Western blot analyses of (A) StAR protein and (B) P450scc enzyme in testes of control mice and after Citrus limon (C. limon) treatment (500 and 1,000 mg/kg body weight for 35 days and sacrificed 24 hours after the last treatment), and after treatment withdrawal. In recovery groups (CR and TR), mice were treated with 1% Tween-80 or with C. limon, 1,000 mg/kg body weight for 35 days, and thereafter the treatment was discontinued and mice sacrificed 56 days post-withdrawal (C, D). Each bar represents mean ± SEM for triplicate blots (n = 5). *Values of band intensity significantly different from controls (p < 0.05). IRDV = integrated relative density value.
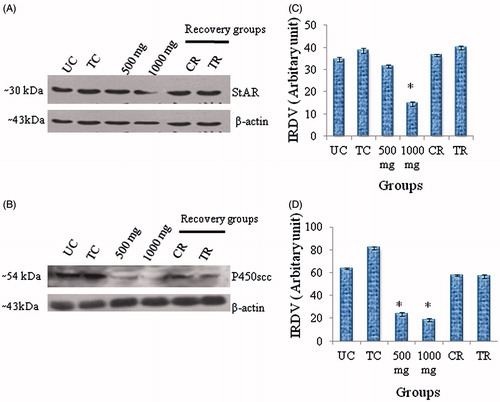
Table 5. Activities of steroidogenic enzymes (3β- and 17β-HSD) in the testis and serum testosterone level in mice after Citrus limon (C. limon) treatment and following treatment withdrawal.
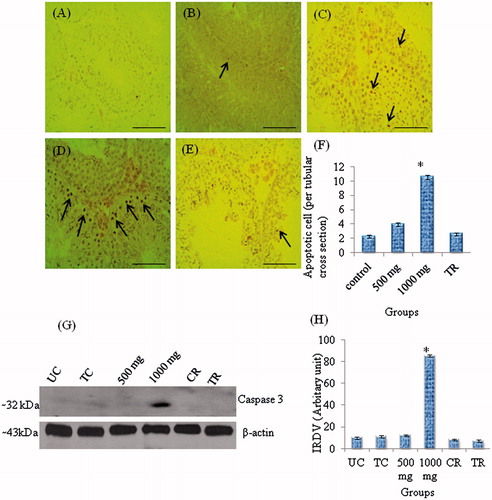
Figure 3. TUNEL staining of apoptotic germ cells in sections of mice testes and Western blot analysis of CASP-3 to detect germ cells apoptosis. (A) TUNEL reaction was conducted omitting TdT as a negative control. (B) Control (1% Tween-80); a TUNEL-positive germ cell (spermatocyte) is seen in a seminiferous tubule in the centre. (C) After Citrus limon (C. limon) treatment, 500 mg/kg body weight/day for 35 days and sacrificed 24 hours after the last treatment to show few TUNEL-positive germ cells (arrows) in the seminiferous tubules. (D) After C. limon treatment, 1,000 mg/kg body weight/day for 35 days and sacrificed 24 hours after the last treatment. Note many TUNEL-positive germ cells (arrows) in the seminiferous tubules. (E) After C. limon, treatment 1,000 mg/kg body weight for 35 days and sacrificed 56 days after treatment withdrawal (Treatment recovery, TR); note TUNEL staining in the seminiferous tubules as in controls (see part B). Scale bar = 50 μm. (F) Number of apoptotic germ cells per tubular cross section. Values are mean ± SEM; n = 5. * Significantly different from controls (p < 0.05). (G) Western blot analysis of CASP-3 in testis of control mice and after treatment with C. limon (500 and 1,000 mg/kg body weight for 35 days and sacrificed 24 hours after the last treatment), and following treatment withdrawal; in recovery groups, mice were treated with 1% Tweeen-80 (control recovery, CR) or C. limon, 1,000 mg/kg body weight for 35 days and thereafter the treatment was discontinued and mice sacrificed 56 days post-withdrawal (treatment recovery, TR). (H) Bar represents mean ± SEM of triplicate blots (n = 5). *Values of band intensity significantly different from controls (p < 0.05). IRDV: integrated relative density value.