977
Views
14
CrossRef citations to date
0
Altmetric
Original Article

Ectopic osteogenic tissue formation by MC3T3-E1 cell-laden chitosan/hydroxyapatite composite scaffold

, &
Pages 1440-1447 | Received 10 Mar 2015, Accepted 23 Mar 2015, Published online: 13 May 2015

Figures & data

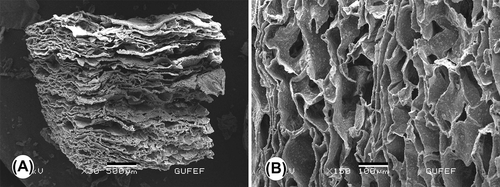
Figure 1. Representative SEM micrographs of the acellular CS/HA scaffold (A, B). Rough structures as a result of the distribution of HA microparticles inside the polymer matrix are visible on the pore walls in B. Scale bars: 500 μm (A), 100 μm (B).
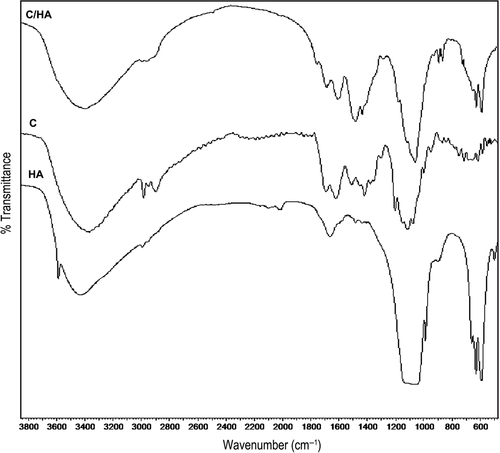
Figure 2. Fourier transform infrared spectra of CS, HA, and the composite scaffold (CS/HA). Protonated amide stretch at 2962 cm−1 and 1380 cm−1; C–O stretching vibrations at 1160 cm−1, 1067 cm−1 and 1031 cm−1; N–H stretching at 3400 cm−1; amide groups at 1660, 1583 and 1456 cm−1; phosphate group at 963 cm−1 and 602 cm−1.
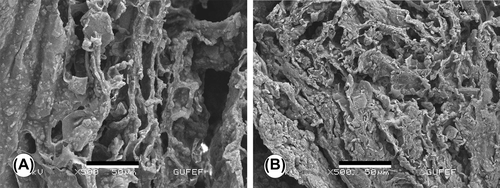
Figure 3. Representative scanning electron micrographs of cell-laden CS/HA scaffold (seeding density of 5.0 × 10⁵ MC3T3-E1 cells/construct); (A) after 7 days, and (B) after 21 days of culture. Note the population of the construct pores with the newly forming tissue along with ECM and mineral deposits, with respect to culture time. Scale bars: 50 μm (A, B).
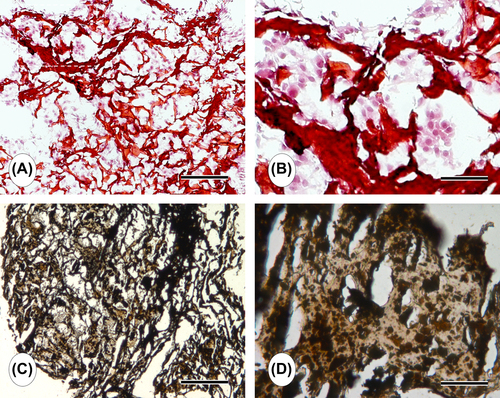
Figure 4. Representative light micrographs of cell-laden CS/HA scaffold. (A) Homogenous distribution of cells inside the construct pores after 7 days of culture is visible (B is the magnified image of A) (H&E-staining). (C) Mineral deposits and ECM have predominantly covered the scaffold after 21 days of culture (D is the magnified image of C) (von Kossa-staining). Scale bars: 300 μm (A, C), 150 μm (B, D).
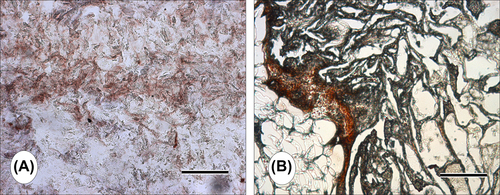
Figure 5. Anti-osteopontin staining of MC3T3-E1 cell-laden CS/HA scaffold after 21 days of culture. Scale bars: 300 μm (A), 150 μm (B).
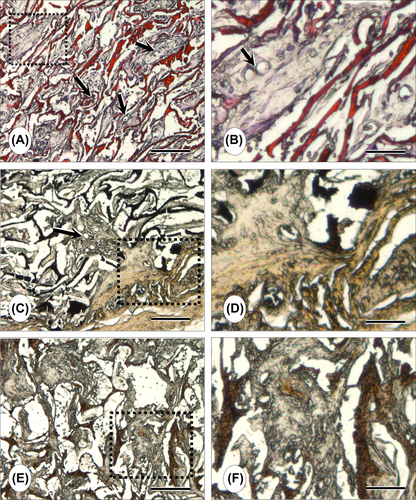
Figure 6. Representative light micrographs of cell-laden CS/HA scaffold grafts at day 14 (A–D) and at day 21 (E, F), post-transplantation. A, B: H&E staining; C–E: von Kossa staining; B, D and F are magnified images of A, B and C, respectively. Capillaries infiltrating newly forming tissue inside construct pores depict an ongoing neovascularization process (A, B). Mineralized ECM deposits are visible in C–F. Note the population of the construct pores with the newly forming tissue along with ECM and mineral deposits, with respect to culture time. Scale bars: 200 μm (A, C, E), 50 μm (B, D, F).

Reprints and Corporate Permissions

Please note: Selecting permissions does not provide access to the full text of the article, please see our help page How do I view content?

To request a reprint or corporate permissions for this article, please click on the relevant link below:

Academic Permissions

Please note: Selecting permissions does not provide access to the full text of the article, please see our help page How do I view content?

Obtain permissions instantly via Rightslink by clicking on the button below:

If you are unable to obtain permissions via Rightslink, please complete and submit this Permissions form. For more information, please visit our Permissions help page.