1,666
Views
22
CrossRef citations to date
0
Altmetric
Original Articles

Graphene and tricobalt tetraoxide nanoparticles based biosensor for electrochemical glutamate sensing

, &
Pages 340-348 | Received 21 Nov 2015, Accepted 04 Feb 2016, Published online: 03 Mar 2016

Figures & data

Scheme 1. The fabrication steps of the biosensor.

Scheme 1. The fabrication steps of the biosensor.

Figure 1. SEM images of (a) Co3O4/CS/GR/GCE and (b) GLOx/Co3O4/CS/GR/GCE surfaces.

Figure 1. SEM images of (a) Co3O4/CS/GR/GCE and (b) GLOx/Co3O4/CS/GR/GCE surfaces.

Figure 2. (A) Cyclic voltammograms of (a) GCE and (b) Co3O4/CS/GR/GCE at 50 mV s1 (B) The Nyquist curves of (a) GCE and (b) Co3O4/CS/GR/GCE in 0.1 M KCl solution containing 5.0 mM Fe(CN)63−/4− (C) Peak currents of Co3O4/CS/GR/GCE as a function of scan rate for the determination of the effective working surface area. Inset: Cyclic voltammograms of the Co3O4/CS/GR/GCE at scan rates of 10, 20, 50, 75, 100, 200, and 300 mV s1 in a 0.1 M KCl solution containing 5.0 mM Fe(CN)63−/4−.

Figure 2. (A) Cyclic voltammograms of (a) GCE and (b) Co3O4/CS/GR/GCE at 50 mV s−1 (B) The Nyquist curves of (a) GCE and (b) Co3O4/CS/GR/GCE in 0.1 M KCl solution containing 5.0 mM Fe(CN)63−/4− (C) Peak currents of Co3O4/CS/GR/GCE as a function of scan rate for the determination of the effective working surface area. Inset: Cyclic voltammograms of the Co3O4/CS/GR/GCE at scan rates of 10, 20, 50, 75, 100, 200, and 300 mV s−1 in a 0.1 M KCl solution containing 5.0 mM Fe(CN)63−/4−.

Figure 3. The effects of (a) enzyme amount (+0.70 V; pH 7.5), (b) buffer pH (+0.70 V), (c) applied potential (pH 7.5), and (d) temperature (+0.70 V; pH 7.5) on the response of GLOx/Co3O4/CS/GR/GCE (0.05 M PBS containing 0.2 mM glutamate).

Figure 3. The effects of (a) enzyme amount (+0.70 V; pH 7.5), (b) buffer pH (+0.70 V), (c) applied potential (pH 7.5), and (d) temperature (+0.70 V; pH 7.5) on the response of GLOx/Co3O4/CS/GR/GCE (0.05 M PBS containing 0.2 mM glutamate).

Figure 4. (a) Calibration curve of the GLOx/Co3O4/CS/GR/GCE, (b) Typical current–time response of the on successive injection of glutamate into a stirred solution of 0.05 M PBS (pH 7.5) at applied potential+0.70 V, and (c) The effect of glutamate concentration upon the amperometric response of the biosensor (0.05 M pH 7.5 PBS, 37 °C).

Figure 4. (a) Calibration curve of the GLOx/Co3O4/CS/GR/GCE, (b) Typical current–time response of the on successive injection of glutamate into a stirred solution of 0.05 M PBS (pH 7.5) at applied potential +0.70 V, and (c) The effect of glutamate concentration upon the amperometric response of the biosensor (0.05 M pH 7.5 PBS, 37 °C).

Figure 5. The repeatability of the GLOx/Co3O4/CS/GR/GCE (0.05 M pH 7.5 PBS, 37 °C).

Figure 5. The repeatability of the GLOx/Co3O4/CS/GR/GCE (0.05 M pH 7.5 PBS, 37 °C).

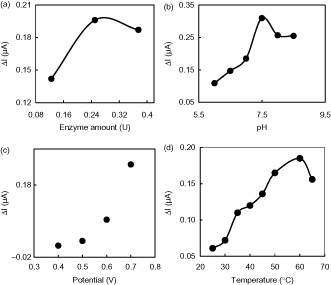
Table 1. The performance parameters and the optimum working conditions of the biosensor.

Table 2. Characteristics of various amperometric glutamate biosensors.

Reprints and Corporate Permissions

Please note: Selecting permissions does not provide access to the full text of the article, please see our help page How do I view content?

To request a reprint or corporate permissions for this article, please click on the relevant link below:

Academic Permissions

Please note: Selecting permissions does not provide access to the full text of the article, please see our help page How do I view content?

Obtain permissions instantly via Rightslink by clicking on the button below:

If you are unable to obtain permissions via Rightslink, please complete and submit this Permissions form. For more information, please visit our Permissions help page.