Figure 1.
(A) Scatterplot of pretreatment 2-[18F]-fluoro-2-deoxyD-glucose positron emission tomography (PET) metabolic activity in the anterior insular cortex of individual patients remitting (REM) and not responding (NR) to treatment with either escitalopram or cognitive behavioral therapy (CBT). Normalized metabolic activity in the anterior insula subdivided patients into hypermetabolic and hypometabolic subgroups. (B) Insula activity correlated with changes in the Hamilton Depression Rating Scale (HDRS) score in the full cohort of subjects treated with either CBT or escitalopram oxalate. From reference 28: McGrath CL, Kelley ME, Holtzheimer PE, et al. Toward a neuroimaging treatment selection biomarker for major depressive disorder. JAMA Psychiatry. 2013:70:821-829.
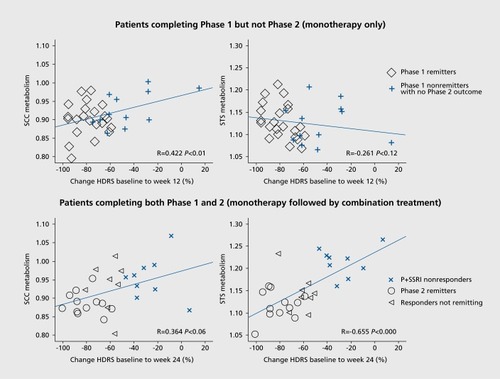
Figure 2
(A) Percent change in the Hamilton Depression Rating Scale (HDRS) after 12 weeks of treatment with either escitalopram or cognitive behavioral therapy (CBT) correlated with pretreatment metabolic activity in the subcallosal cingulate cortex (SCC) and superior temporal sulcus (STS). (B) Percentage change in HDRS correlated with pretreatment SCC and STS metabolic activity among patients completing 12 weeks of monotherapy followed by 12 weeks of combination escitalopram plus CBT. From reference 65: McGrath CL, Keliey ME, Dunlop BW, Holtzheimer PE, Craighead WE, Mayberg HS. Pretreatment brain states identify likely nonresponse to standard treatments for depression. Biol Psychiatry. 2014:76:527-535.

![Figure 1. (A) Scatterplot of pretreatment 2-[18F]-fluoro-2-deoxyD-glucose positron emission tomography (PET) metabolic activity in the anterior insular cortex of individual patients remitting (REM) and not responding (NR) to treatment with either escitalopram or cognitive behavioral therapy (CBT). Normalized metabolic activity in the anterior insula subdivided patients into hypermetabolic and hypometabolic subgroups. (B) Insula activity correlated with changes in the Hamilton Depression Rating Scale (HDRS) score in the full cohort of subjects treated with either CBT or escitalopram oxalate. From reference 28: McGrath CL, Kelley ME, Holtzheimer PE, et al. Toward a neuroimaging treatment selection biomarker for major depressive disorder. JAMA Psychiatry. 2013:70:821-829.](/cms/asset/89243f58-fe03-4b24-a704-3f04353cefed/tdcn_a_12130982_f0001_oc.jpg)