Figures & data
Table 1. Characteristics of the participants
Fig. 1. Percentage of participants (n=76) classified as underreporter, acceptable reporter and overreporter by the ratio energy intake over total energy expenditure (EI/TEE) clustered by gender and method (estimated dietary record; EDR (a), 24-hour recall; 24HR (b). The lower and upper ratio cut-offs for EDR and 24HR are 0.80 and 1.20; and 0.72 and 1.28, respectively. *Number of underreporters in men was significantly lower compared to women (χ22= 6.361, p = 0.042)).
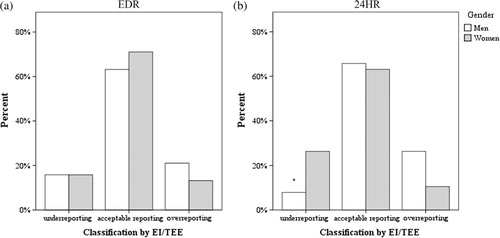
Table 2. Mean usual intakes, p-values for t-tests, ratios and Spearman correlations of macronutrients by both methods. All data are adjusted for day of week and age (in years). Figures representing total sample are additionally adjusted for gender
Table 3. Mean usual intakes, p-values for t-tests, ratios and Spearman correlations of micronutrients by both methods. All data are adjusted for day of week and age (in years). Figures representing total sample are additionally adjusted for gender
Table 4. Agreement between EDR and 24HR by ranking of participants in tertiles expressed as weighted Kappa coefficients with 95% confidence intervals