313
Views
1
CrossRef citations to date
0
Altmetric
Original Articles

The effect of α- or β-casein addition to waxy maize starch on postprandial levels of glucose, insulin, and incretin hormones in pigs as a model for humans

, , , , , , & show all
Article: 7989 | Received 08 Jul 2011, Accepted 08 Feb 2012, Published online: 13 Apr 2012

Figures & data

Fig. 1.  Gelatinisation profile of 10% starch (

), 10% starch + 10% α-casein (
), and 10% starch + 10% β-casein (
); (x) represents temperature profile. Point A on the curve represents the on-set stage of pasting, B represents peak viscosity on heating, C represents viscosity at end of heating, D represents viscosity at end of cooling, and E represents the final viscosity of the paste.

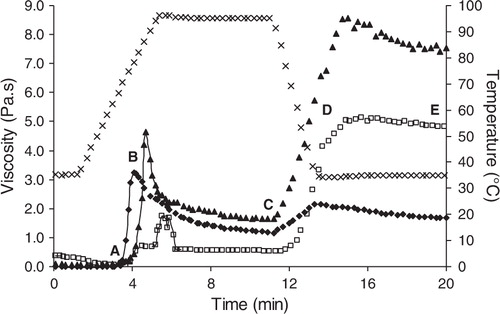
Table 1. Pasting viscosities of treatments throughout gelatinisation.

Fig. 2.  Postprandial blood glucose concentrations following ingestion of 10% starch (

), 10% starch + 10% α-casein (
) and 10% starch + 10% β-casein (
). (a-b)Values with different lowercase letters are significantly different (p < 0.05).

Table 2. Plasma GLP-1 concentrations (pmol/L) at T0 and T90 following ingestion of 10% starch, 10% starch + 10% α-casein, and 10% starch + 10% β-casein.

Fig. 3.  (A) Plasma GIP concentrations following ingestion of 10% starch, 10% starch + 10% α-casein, and 10% starch + 10% β-casein. Preprandial GIP concentrations [horizontal], 30 min postprandial [slanted], and 90 min postprandial [vertical]. (B) Insulin concentrations (in plasma) following ingestion of 10% starch, 10% starch + 10% α-casein, and 10% starch + 10% β-casein. Preprandial insulin concentrations [horizontal], 30 min postprandial [slanted], and 90 min postprandial [vertical]. (C) Total amino acid levels of 10% starch, 10% starch + 10% α-casein, and 10% starch + 10% β-casein postprandial at T30 (slanted line) and T90 (vertical line).(a-b)Values with different lowercase letters are significantly different from each other (p < 0.05).

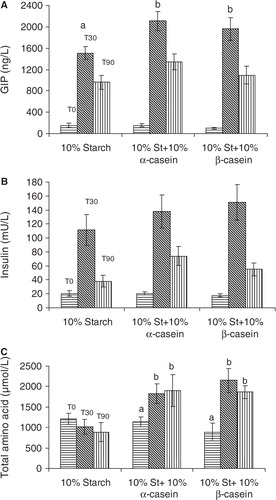
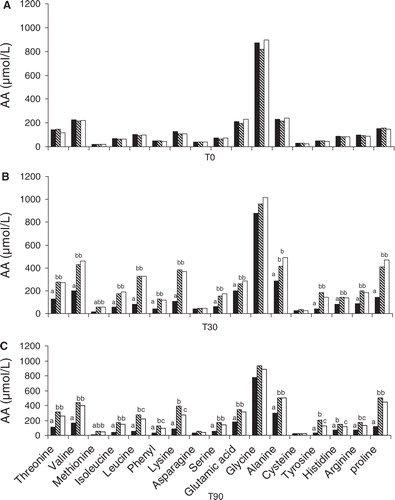
Fig.4.  (A) Concentrations of free amino acids in plasma preprandial (T0) of 10% starch (

), 10% starch + 10% α-casein (
), and 10% starch + 10% β-casein (
). (B) Concentrations of free amino acids in plasma postprandial (T30) of 10% starch (
), 10% starch + 10% α-casein (
), and 10% starch + 10% β-casein (
). (a-b)Values with different lowercase letters are significantly different from each other (p < 0.05). (C) Concentrations of free amino acids in plasma postprandial (T90) of 10% starch (
), 10% starch + 10% α-casein (
), and 10% starch + 10% β-casein (
). (a,b,c)Values with different lowercase letters are significantly different from each other (p < 0.05).