Figures & data
Table 1 Description of the food consumption data
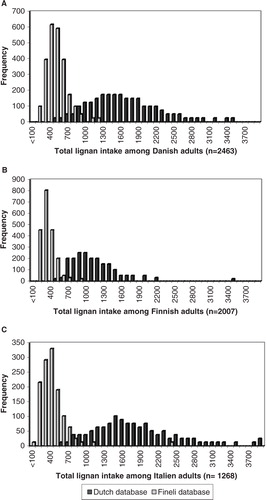
Table 2 Lignan intakes (g/day) from five European countries calculated using the Dutch and the Finnish (Fineli®) lignan database (mean values)
Table 3 Contribution of aggregated food groups and individual foods to the total lignan intake by gender in five European countries calculated using the Dutch lignan database1(%)
Appendix A. Content of lignan and lignan precursors (SECO, MAT, LARI, PINO) in foods and notes on which the lignan values were chosen
Lyhne N, Groth MV, Christensen T, Fagt S, Biltoft-Jensen A, Hartkopp H, etal. Danskernes kostvaner 2000–2002. hovedresultater (Dietary habits in Denmark 2000–2002). 2005; Søborg, Denmark: Danish Institute of Food and Veterinary Research. Männistö S, Ovaskainen M-L, Valsta L. The national findiet study. 2002; Helsinki, Finland: National Public Health Institute. 2003. Turrini A, Saba A, Perrone D, Cialfa E, D'Amicis A. Food consumption patterns in Italy: the INN-CA study 1994–1996. Eur J Clin Nutr. 2001; 55: 571–88. Wolk A, Bergstrom R, Hunter D, Willett W, Ljung H, Holmberg L, etal. A prospective study of association of monounsaturated fat and other types of fat with risk of breast cancer. Arch Intern Med. 1998; 158: 41–5. Henderson L, Gregory J, Swan G. The National diet and nutrition survey: adults aged 19–64 years. Types and quantities of foods consumed. Report of the office for national statistics and food standard agency. 2002; London: TSO.