
Figures & data
Fig. 1 The household addresses of study subjects plotted throughout Peninsular Malaysia using Quantum GIS 2.8.1.
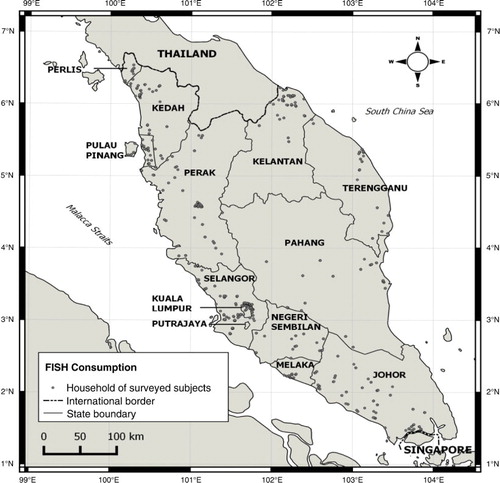
Table 1 Socio-demographic characteristics of the subjects
Fig. 2 Number of days (in percentages) in which fish was consumed among the adults of different ethnicities from Peninsular Malaysia, using 3-day records of food consumption as a survey method.
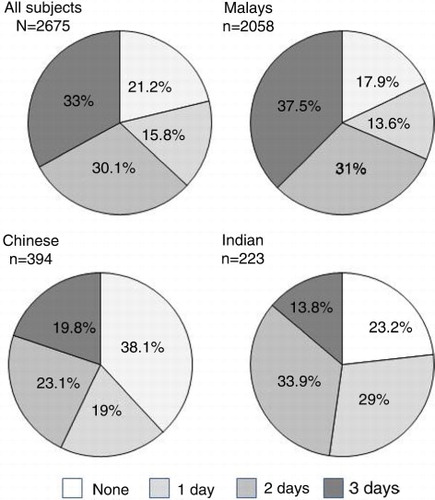
Table 2 Fish frequencies from 3-day records of food consumption survey conducted among adults of Peninsular Malaysia (n=2,675)
Table 3 Frequencies of cooking style obtained from 3-day records of the food consumption survey conducted among adults of Peninsular Malaysia (n=2,675)
Table 4 Seafood consumption (g/person/day) (±IQR)a among adults of different ethnics in Peninsular Malaysia
Table 5 Comparison of seafood consumptions in Peninsular Malaysia with different factors (n=2,675)