
Figures & data
Table 1 Details of the DEC pathotypes recovered from different sources along with their target gene amplification.
Fig. 1 PFGE profile of DEC pathotypes isolated from different sources. The genotypic patterns generated by PFGE were analysed using the Phoretix 1D pro software (Total Lab, UK). The clustering was performed by UPGMA and the dice correlation coefficient.
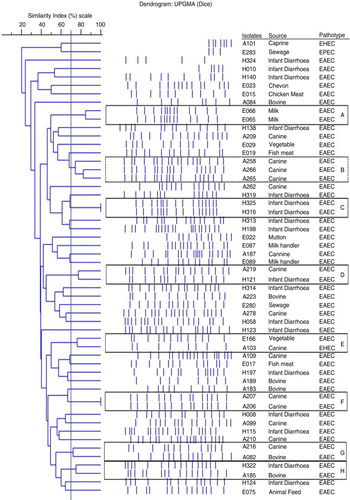
Table 2 The antibiogram profile of the DEC pathotypes
Table 3 Statistical analysis for resistance pattern among human, animal, and environmental isolates using chi-squared test
Table 4 Correlation of PFGE and antibiogram profile of DEC pathotypes isolates
Supplemental material