
Figures & data
Table I. Descriptive statistics of the participants, Inuit Health in Transition – Greenland Survey 2005–2010 (n=3,108)
Fig. 1. Unadjusted variation in the distribution of (a) SBP and (b) DBP among participants living in two communities categorized as A. a village with low SES and B. a town with average SES. Inuit Health in Transition – Greenland Survey 2005–2010.
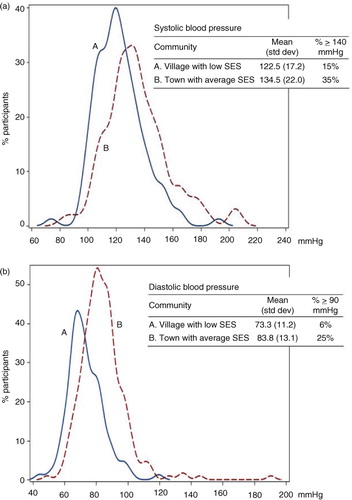
Table II. Multilevel associations (coefficient [coeff] and 95% confidence intervals [95% CI]) between systolic and diastolic blood pressure and individual-level and community-level socio-economic status (SES), adjusting for individual characteristics, Inuit Health in Transition – Greenland Survey 2005–2010; n=2,992
Table III. Sex-stratified multilevel associations (coefficient [coeff] and 95% confidence intervals [95% CI]) between systolic and diastolic blood pressure and individual-level and community-level socio-economic status (SES), adjusting for individual characteristics, Inuit Health in Transition – Greenland Survey 2005–2010; n=1,294 for men, and n=1,648 for women