Figures & data
Table I. Homogeneous bare membrane compositions for membranes A, B, C and D
Fig. 1. PE staining at the surface of MPs. A–C, a cell-associated MP is stained positive for surface PE using Duramycin. Scale bars represent 5 µm. D–F, isolated MPs are consistently stained positive for surface PE. Scale bars represent 3 µm.
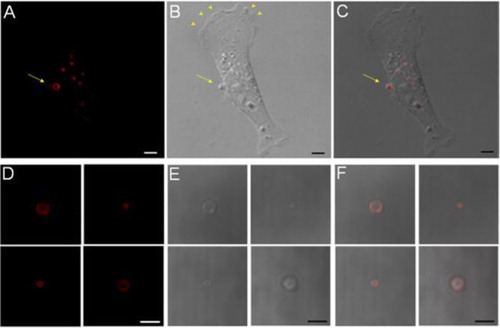
Fig. 2. Colocalisation of surface PE with endogenously expressed probes. A–C, a greater presence of an endogenous PS-binding probe, Lact-C2-GFP, at the inner leaflet of MP membrane is colocalised with PE staining from the outer surface (arrows). D–F, an endogenous PIP2 probe has a partial colocalisation with PE staining (arrows); but with many mismatches (arrow heads). G–I, a general probe for the PM also had a partial colocalisation in MPs, with mismatches (arrow heads). Scale bars represent 5 µm. J, a summary for rates of colocalisation between surface PE and PS, PIP2 or PM.
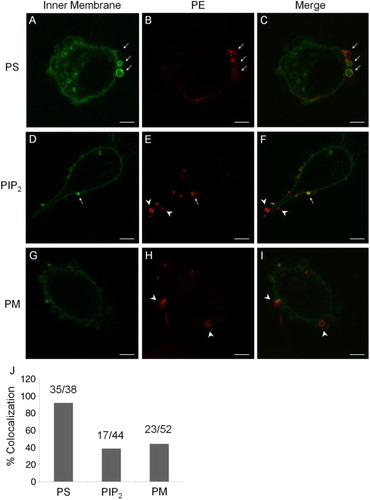
Fig. 3. Colocalisation of RhoA probes in MPs. A–C, an intense presence of GFP-RhoA in PE-positive MPs (arrows). D–F, colocalisation of constitutively active GFP-RhoA in PE-positive MPs (arrows). G–I, substitution of cationic residues in the PBR of GFP-RhoA with Gln (PBRQ) abolished MP localisation and resulted in a mismatch with MPs (arrow heads). J–L, the PBRQ mutant of GFP-CA-RhoA has poor colocalisation in MPs. Scale bars represent 5 µm. M, a summary for rates of colocalisation between surface PE and RhoA derivatives.
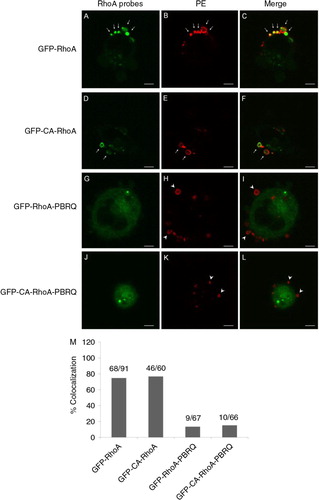
Fig. 4. Colocalisation of native RhoA in MPs. A–C, the presence of native RhoA in MPs, as detected by immunocytochemistry, is colocalised with PE staining from the outer surface. D, MPs harvested from the culture media contained relatively high levels of native RhoA compared to total cell lysate, as detected using Western blotting. Scale bars represent 5 µm.
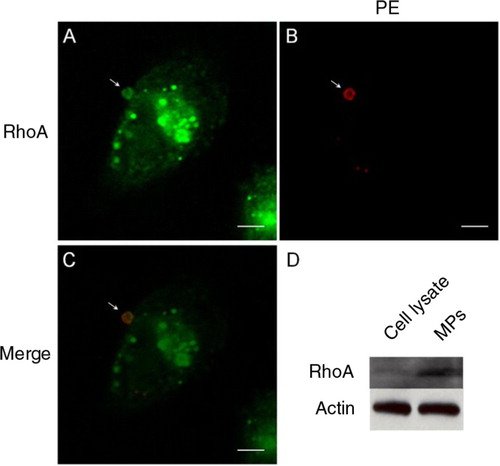
Fig. 5. Electrostatic-dependent localisation of protein factors in MPs. A–C, the colocalisation of a general probe consisting of EGFP and the C-terminal PBR of RhoA (EGFP-PBR) in MPs (arrows). D–F, Gln substitution of basic residues abolished the probe localisation in MPs (arrow heads). Scale bars represent 5 µm. G, a summary for rates of colocalisation between surface PE and GFP chimers carrying the PBR or PBRQ.
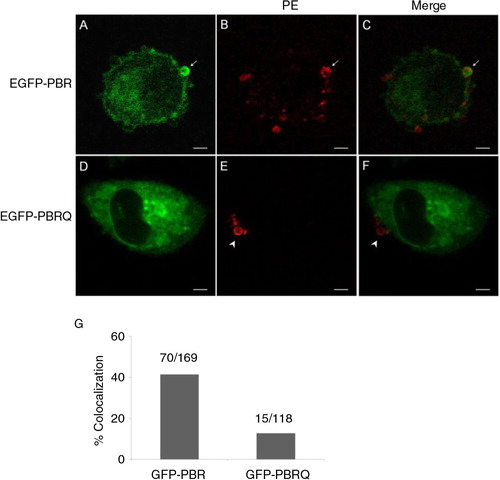
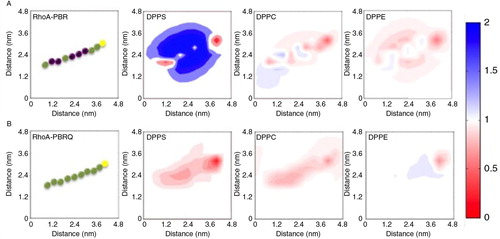
Table II. Calculated relative free energy of adsorption of PBR on membranes A, B, C and D
Table III. Calculated relative free energy of adsorption of PBRQ membranes A, B, C and D
Fig. 6. Molecular theory predictions of PBR-membrane interactions. A, the presence of DPPS in the membrane substantially enhanced PBR adsorption. The PBR is represented as a string of beads, where basic residues are purple, neutral green and Cysteine yellow. The adsorption of PBR induced a lateral rearrangement of DPPS to congregate in the vicinity of the peptide, which was accompanied with a reduction of local PE and PC levels. The colour bar on the right side represents the fold change, where blue indicates a 2 fold enhancement and red approaches an absence of enhancement. B, the mutant PBRQ resulted in minimal re-organisation in all phospholipids.