Figures & data
Fig. 1. Image of size-exclusion chromatography column. A 10 mL syringe stacked with sepharose CL-2B for isolation of vesicles from platelet-free supernatant of platelet concentrates.
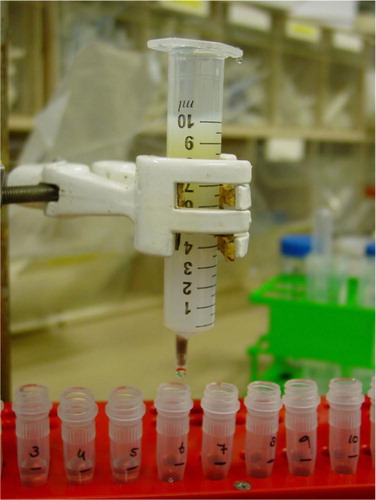
Fig. 2. Presence of vesicles, protein and lipoproteins per fraction. The concentration of vesicles, protein and lipoproteins was measured in each fraction. Each bar shows the number present in a fraction as % of the total number that passed the column. The height of the bar represents the mean, the error bars the standard deviation from 3 experiments. a) Particles (larger than 70 nm) measured by NTA. b) Particles (100–400 nm) measured by RPS. c) CD61+ vesicles measured by flow cytometry. d) Lactadherin+vesicles measured by flow cytometry. e) HDL (Cholesterol) concentration measured by a colorimetric assay. f) HDL (APO A1) concentration measured by a turbidimetric assay. g) Protein concentration measured by a Bradford protein assay h) Overview of all measured results.
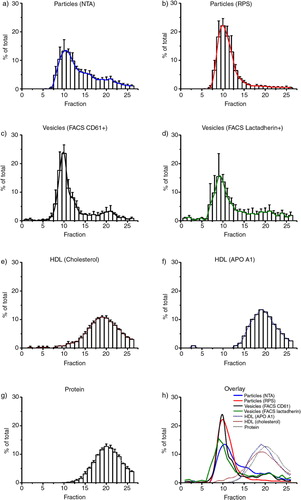
Fig. 3. Presence of proteins, CD63 and CD9 in collected fractions. a) The presence of proteins in each fraction determined by loading 20 µL on PAGE gels. The molecular weight of albumin is 66 kDa. b,c) Presence of tetraspanins in the different fractions was studied by Western blot, with 4 µg protein used per fraction. First, the presence of CD63 was shown (53 kDa, panel b), and next the presence of CD9 was shown (24 kDa, panel c). The tetraspanin bands are indicated by arrows in panels b and c. Platelet lysate was used as positive control.
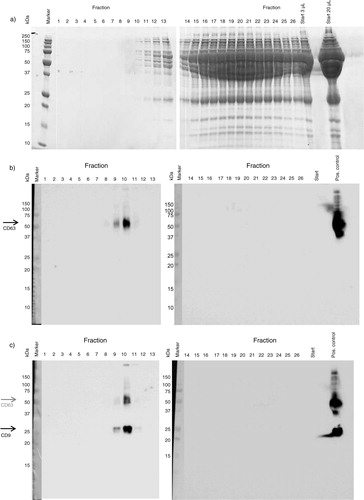
Fig. 4. TEM images of fractions. Starting material and fractions, undiluted or 50-fold diluted when indicated, were analysed by TEM for the presence of particles. All images shown are representative images for the starting material (a, j) and fractions 5, 9, 10, 11, 17, 18, 19 and 20 (b–i, k–n). Scale bar is 200 nm (a–g, j–n), 500 nm (h), or 1 µm (i).
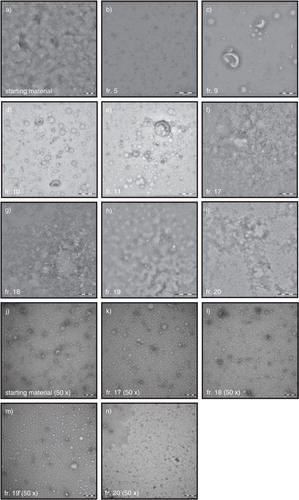
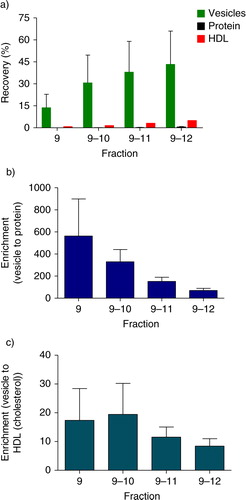
Fig. 5. Recovery and enrichment. The recovery and enrichment relative to the starting material, in the vesicle-containing fractions (9, 9–10, 9–11, 9–12) are shown. a) Recovery of vesicles, protein and HDL (cholesterol) in the vesicle-containing fractions. b) Enrichment factor of vesicle to protein. c) Enrichment factor of vesicle to HDL (cholesterol).