
Figures & data
Fig. 1. Work flow of study design and sample processing. Whole blood from 3 different individuals was collected by venepuncture into each tube using a Multi-fly and processed to analyse intracellular, cell-free and exosomal miRNA. Asterisks indicate the point of RNaseA treatment (100 ng/ml, 37°C for 10 minutes) to investigate RNA degradation in these samples. The workflow outlines the sample collection and preparation from 1 individual. The number of tubes collected from each volunteer was: 2×PAXgene 2.5 ml tubes, 3×Sarstedt S-Monovette serum-gel 7.5 ml tubes and 3×Sarstedt S-Monovette EDTA 7.5 ml tubes. Upon centrifugation of the Sarstedt S-Monovette EDTA tubes, approximately 10 ml of plasma was obtained across 3 Sarstedt S-Monovette tubes which are then separately aliquoted into Lo-Bind DNA tubes (4×1 ml, 2×1.2 ml tubes) for RNA analysis and deep sequencing. The remaining plasma was aliquoted for Western immunoblotting (WB, 1.2 ml), transmission electron microscopy (EM, 1.2 ml) and qNano (1 ml) analysis. For the RNA work involving RNaseA treatment, samples were allocated for an untreated control and RNaseA treatment: 2×1.2 ml for the ultracentrifugation exosomal RNA isolation (Plasma UC), 2×1 ml for the Norgen Biotek exosomal RNA isolation (Plasma NG), and 2×1 ml aliquot was reserved for cell-free plasma RNA isolation. The collection process and sample allocation are repeated for serum collection. Exosomes isolated from serum via the ultracentrifuge are denoted as Serum UC. Exosomal RNA isolated by the Norgen Biotek Kit are denoted as Serum NG. As for the 2×PAXgene tubes, RNA is isolated from 2.5 ml of whole blood per tube and isolated as recommended by the manufacturers protocol. One tube was treated with RNaseA and one was left untreated.
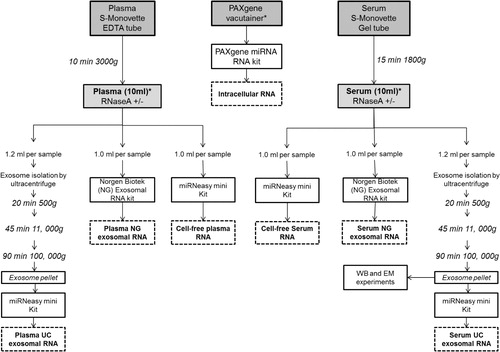
Fig. 2. Small RNA profiles extracted from intracellular, cell-free and exosomal isolation from blood before and after RNaseA treatment. RNA was extracted from samples and run on a Small RNA Bioanalyser assay. Experiments shown here are representative of samples collected from 1 volunteer.
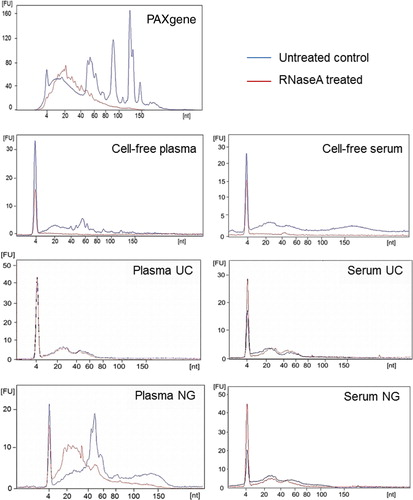
Table I. Yield and percentage of miRNA extracted from intracellular, cell-free and exosomal samples prepared from plasma and serum
Fig. 3. Characterization of plasma and serum exosomes isolated by differential ultracentrifugation. (A) Western immunoblotting of exosomal markers flotillin, CD-63, transferrin, PrP (109–112) and Hsp70 in cell-free (CF) and exosomal (E) samples in plasma and serum. (B) Plasma and serum exosomes were analysed under electron microscopy which displayed the same morphology. Plasma exosomes are shown here. Insert is a larger magnification of the exosomal vesicles. Bar = 100 nm (C) Size distribution of exosomes analysed by the qNano particle counter. Experiments shown here are representative of samples collected from 1 volunteer.
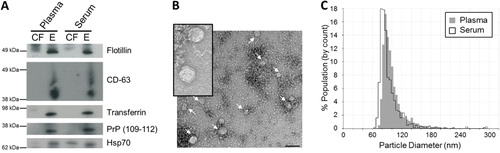
Fig. 4. Percentage and number of known miRNA species detected in intracellular, cell-free and exosomal samples by NGS. Raw reads were aligned to the human genome (HG19) and mapped to miRBase V.20 and other small RNA from Ensembl Release 74 followed by normalization of raw reads to RPM. The mean of reads per miRNA (n=3) was calculated. A) Percentage of total reads mapped to non-coding small RNA and other RNA species identified by deep sequencing. B) Venn diagrams showing unique and common miRNA detected in different components of blood. miRNA with read counts >5 reads per million were shown for comparison. miRNA identified in this study was uploaded to http://www.microvesicles.org (Citation17).
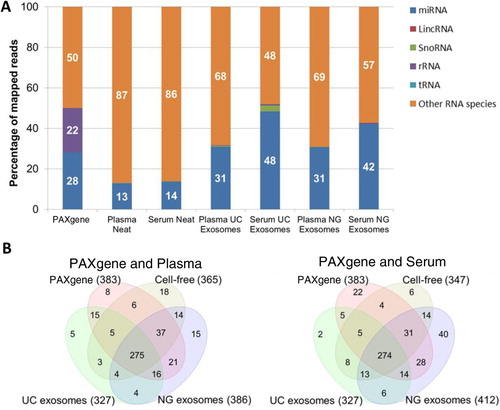
Table II. Normalized reads of the top 25 miRNA detected in PAXgene intracellular samples compared to cell-free and exosomal samples prepared from plasma and serum
Fig. 5. Presence and absence of the highly abundant miRNAs identified across intracellular blood, cell-free samples and exosomes samples. Raw reads were aligned to the human genome (HG19) and mapped to miRBase V.20 followed by normalization of raw reads to RPM. The mean was calculated across 3 volunteer samples. miRNA with read counts >5 reads per million were shown for comparison. Hierarchical clustering was performed across samples and miRNA. Data has been uploaded to http://microvesicles.org/.
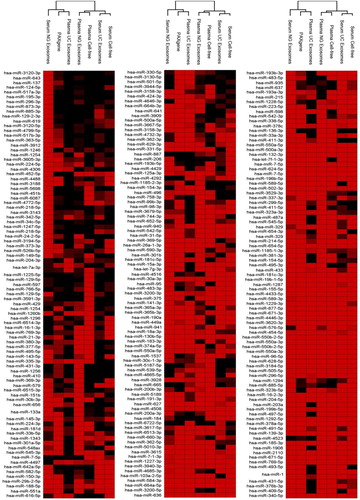
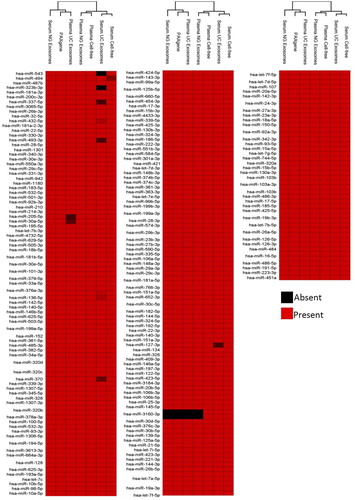
Fig. 6. Schematic summary of unique miRNA detected in intracellular, cell-free and exosomal samples prepared from plasma and serum.
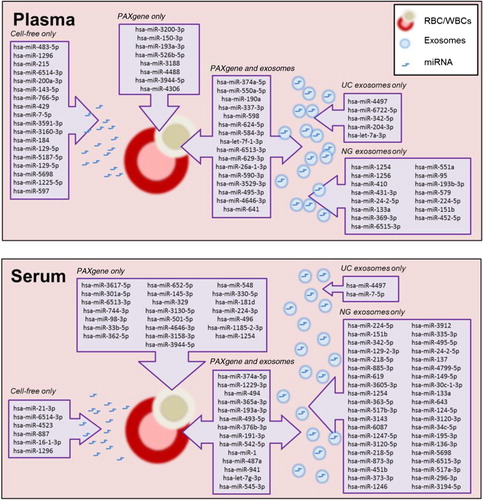
Table III. Predicted pathways targeted by miRNAs expressed in intracellular, cell-free and exosomal samples