Figures & data
Table I. Effect of cavin-1 expression on proteins in PC3 EVs with reported roles in bone metastasis
Fig. 1. Cavin-1 altered EV proteins and EV miR-148a with no effect on total cellular levels. (A) EVs and whole cell lysates (WCL) were collected from GFP-PC3 and cavin-1-PC3 cells and analysed by Western blot with the indicated antibodies. EV preparations were free from ER protein calnexin. Equal loading was shown by Coomassie staining. Images are representative of 3 biological replicates. Raw images of the western blots are available in figures in Supplementary file. (B) Cavin-1 alters the miRNA content of EVs. Real-time qPCR was performed on cDNA synthesized from equal amounts of RNA extracted from GFP-PC3-EVs and cavin-1-PC3-EVs or total cell lysates. Bar graphs show the mean relative expression±SEM of miR-148a was significantly decreased in cavin-1-PC3-EVs compared to GFP-PC3-EVs (p=0.02, n=3) but expression of miR-148a was unaffected in cells. (C) In contrast, miR-125a was not significantly different between GFP-PC3-EVs and cavin-1-PC3-EVs (n=3).
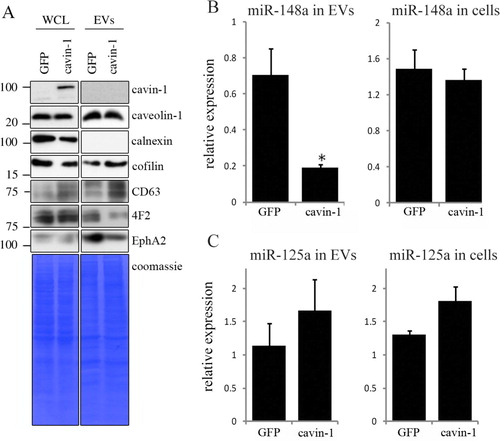
Fig. 2. PC3-EV activity is attenuated by cavin-1 expression. (A) RAW264.7 cell differentiation to osteoclast was measured by the number of TRAP-positive (pink) multi-nucleated cells (3 or more nuclei) after treatment for 6 days, as detailed in Methods. Representative microscopic images show negative control (PBS), positive control (RANKL) and effects of GFP-PC3-EV and cavin-1-PC3 EV. Bar=50 µm. (B) RAW264.7 cells were treated with 20 µg/mL of total secretome (Sec.), soluble secretome fraction (SF), EV, or control (PBS or 50 ng/mL RANKL). The number of TRAP-positive multinucleated cells was quantified over 4 independent experiments, each with triplicate wells. Significance from PBS control is indicated by ** p<0.005, ** p<0.0005, **** p<0.00005. (C) Actin rings in osteoclasts were determined by staining with Texas Red conjugated phalloidin to stain for actin (red), and DAPI to stain for nuclei (blue). There was no significant difference between RANKL and GFP-PC3-EV-induced osteoclasts (n=3). Bar=20 µm. (D) Primary hOB cells (3 independent lines) were treated with 5 µg of total secretome (Sec.), soluble secretome fraction (SF), EV, or control (PBS control) for 48 hours. Proliferation was measured by AlamarBlue assay, with 4 replicates per experiment. Significance from PBS control is indicated by *<0.05, ** p<0.005, *** p<0.0005. NS, not significant.
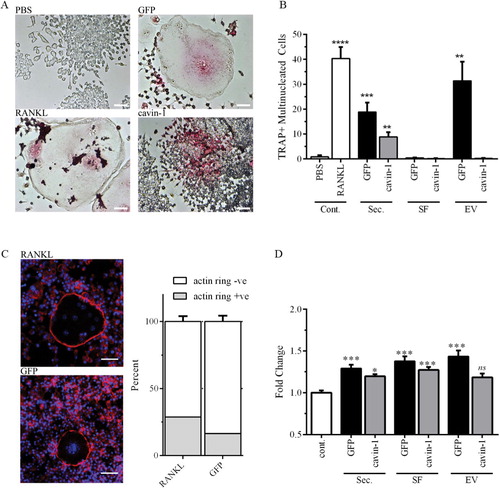
Fig. 3. Cavin-1 expression does not change the size or quantity of EVs released. (A) EVs (indicated by arrows) isolated from GFP-PC3 and cavin-1-PC3 cells were inspected by electron microscopy for morphological differences. Scale bar=1000 nm. (B) The diameter of GFP-PC3-EVs (n=916) and cavin-1-PC3-EVs (n=965) was quantitated using ImageJ and represented as a histogram (Each bar indicates the percentage of EVs up to mean diameter±SEM, that is, 40 nm means between 30–40 nm) and (C) the average EV diameter±SEM plotted as a bar graph. No significance difference was observed in the average diameter between GFP-PC3-EVs and cavin-1-PC3-EVs. (D) Representative images of 4F2 immunolabelled EVs showing 4F2 labels a range of different sized EVs. Scale bar=500 nm. (E) The mean diameter±SEM of 4F2 labelled EVs (n=107) were quantitated using ImageJ and represented as a histogram. Each bar indicates up to diameter, i.e. 40 nm means 30–40 nm. The protein concentration of GFP-PC3-EVs and cavin-1-PC3-EVs was quantitated using Bradford assay and normalized to (F) total cell number and (G) µg per whole cell lysate (WCL) protein estimation from the cells they were derived. No significant differences were observed (mean±SEM, n=3).
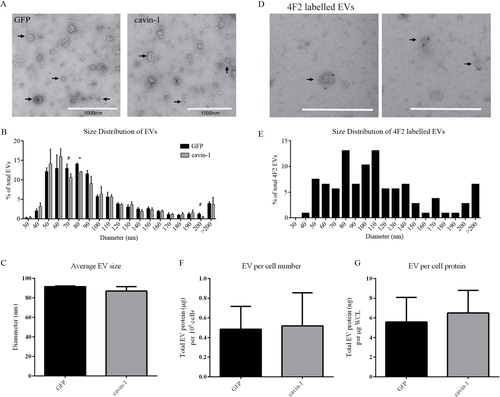
Fig. 4. In vitro uptake of EVs. (A) PC3-EVs were labelled with CellVue Claret and incubated with RAW264.7 or hOB cells at 37°C for the indicated times. Cells were co-stained with anti-tubulin antibody (green staining) and cell surface-bound or cell-internalized EVs were visualized by the red stain. As a control, CellVue dye was centrifuged alongside EVs, and the pellet re-suspended and added to cells (bottom panel). Representative confocal microscopy images are shown. Bar=10 µm. (B, C) EV uptake was quantified using ImageJ to measure total cellular fluorescence for 20–40 cells at each time point, across 3 independent experiments. The background fluorescence of cells incubated with CellVue dye subtracted to derive Δ Mean Fluorescence Intensity (±SEM). (D, E) 20 µg EVs from GFP or cavin-1 PC3 cells were treated with proteinase K, neuraminidase or PBS control, labelled with PKH2 and then incubated with 4×10⁵ RAW264.7 cells seeded in tubes at 37°C for 2 hours. Uptake of fluorescence was determined by flow cytometry, with untreated cells used for background fluorescence levels. Data over 3 independent experiments were analysed for (D)% fluorescent cells and (E) Δ Mean Fluorescence Intensity±SEM.
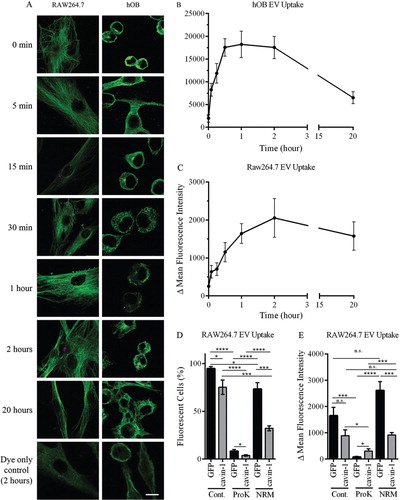
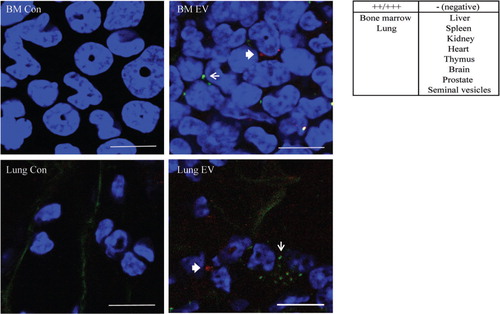
Fig. 5. EV in vivo distribution. PKH2 labelled GFP-PC3-EVs (green) and CellVue Claret labelled cavin-1-PC3-EVs (red) were injected into the tail vein of NOD/SCID mice. Control mice were injected with PBS. After 24 hours, the bone marrow, lung, heart, spleen, liver and kidney were excised, fixed in 4% PFA and stained with DAPI (blue) to visualize nuclei. The arrow (GFP-PC3-EVs green) and the bold arrow (cavin-1-PC3-EVs, red) indicate labelled EV uptake observed in bone marrow and lung. Bars=10 µm.