Figures & data
Table I Oligonucleotide primers used in this study
Table II Antigens used for expression in OMVs
Fig. 1 Expression of heterologous antigens in OMVs – (a) SDS-PAGE analysis of E. coli BL21ΔompA total cell extracts expressing selected antigens. Bacteria were grown to mid-log phase and recombinant protein expression induced (+) or not induced (−) with IPTG; 1 ml aliquots were collected by centrifugation, suspended in 100 µl of SDS-PAGE loading buffer and 25 µl aliquots were loaded in each lane. Bands corresponding to recombinant antigens are boxed. (b) SDS-PAGE analysis of OMV from E. coli BL21ΔompA expressing selected antigens. OMVs were purified by ultracentrifugation of 200 ml bacterial culture supernatants and pellets were suspended in 200 µl of PBS. Aliquots corresponding to 30 µg of total OMV proteins were added with SDS-PAGE loading buffer and loaded to each lane. Bands corresponding to recombinant antigens are boxed. (c) Western Blot analysis of total cell extracts and OMVs from E. coli BL21ΔompA expressing the selected antigens in their cytosol. Bacteria were grown to mid-log phase and protein expression was induced with IPTG. OMVs were purified from the culture supernatants by ultracentrifugation; antigen expression was assessed in total cell lysates (TL) and in the purified OMV fraction using antigen-specific polyclonal antibodies. Polyclonal antibodies against the periplasmic Maltose binding protein (Mbp) were used as a control for OMV quantitation and integrity. (d) Estimation of the amount of heterologous proteins incorporated into OMVs. Different quantities of purified recombinant proteins and OMVs expressing the protein of interest were analyzed by Western Blot. From the comparison of band intensities, the following percentages (µg of antigen expressed in OMVs/µg of total proteins ×100) were estimated: Bla: 5%; Slo: 5%; SpyCEP: 10%; Spy0269: 0.5–1%; SAM_1372: 0.5%.
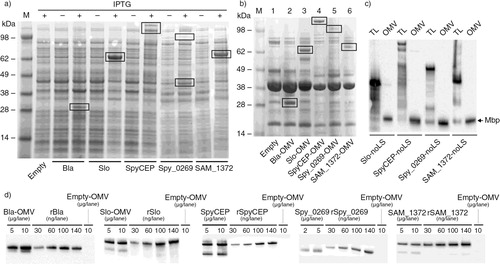
Fig. 2 Analysis of OMV dimension by light scattering – The size of OMVs released from E. coli BL21ΔompA strain expressing SAM_1372, SpyCEP, Slo, or no antigens was determined by dynamic light scattering, measuring the back scattering intensity (175°) at 25°C. The graph represents the average size distribution from 3 independent measurements.
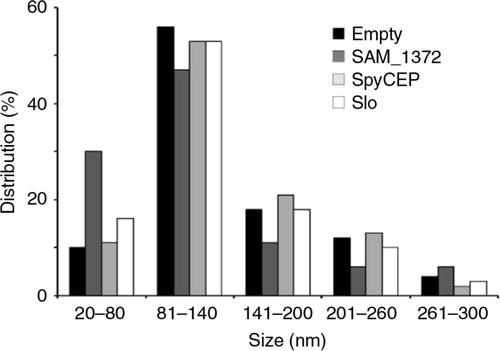
Fig. 3 Analysis of antigen localization in OMVs. – Purified OMVs expressing heterologous proteins were incubated with and without proteinase K in the presence or absence of 1% SDS. Samples were then subjected to SDS-PAGE and Western Blot analysis using antigen-specific polyclonal antibodies. The data indicate that all recombinant antigens are localized in the lumen of OMVs.
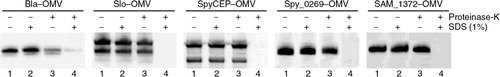
Fig. 4 Analysis of the functional activities of protein antigens expressed in the lumen of OMVs – (a) Haemolytic activity of Slo-OMVs. Aliquots of purified OMVs were incubated with sheep erythrocytes and absorbance at OD540 was measured from the supernatant of each sample. Haemolytic activity is expressed as percentage of OD values over the OD values obtained incubating erythrocytes with water (100% haemolysis). (b) Proteolytic activity of SpyCEP-OMVs. 10 µg of SpyCEP-OMVs and “empty” OMVs were permeabilized with Triton X-100 and subsequently incubated with IL-8. IL-8 hydrolysis was followed by Western Blot analysis using anti-IL-8 specific antibodies. (c) β-lactamase activity of Bla-OMVs – Bla-OMVs and “empty” OMVs were permeabilized with Triton X-100, and β-lactamase activity was monitored by following the hydrolysis of nitrocefin at OD485. β-lactamase concentration in OMVs (ng of active enzyme/µg OMVs) was estimated using a standard curve obtained with purified β-lactamase as determined by spectrophotometry.
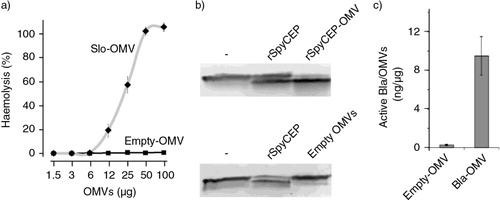
Fig. 5 IgG titers elicited in mice immunized with Slo-OMVs (a), SpyCEP-OMVs (b) and SAM_1372-OMVs (c). Groups of 6 CD1 female mice were immunized i.p. 3 times at 2-week intervals with the following immunogens formulated in Alum: 25 µg OMVs expressing the recombinant antigens (Slo-OMVs, SpyCEP-OMVs, SAM_1372-OMVs), 20 µg of purified recombinant antigen (Slo, SpyCEP, SAM_1372), 25 µg empty OMVs combined with 20 µg of purified recombinant antigen (OMVs + Slo, OMVs + SpyCEP), adjuvant alone (Alum). Sera were collected 2 weeks after the third immunization and IgG titers were analyzed by ELISA, using plates coated with the corresponding recombinant antigen (1 µg/well). Each symbol represents the ELISA value of an individual mouse. Horizontal bars represent the geometric mean values within each group.
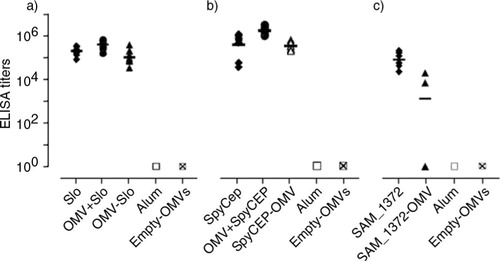
Fig. 6 Isotype analysis of antibodies elicited in mice immunized with Slo-OMVs and SpyCEP-OMVs – Sera from mice immunized i.p. 3 times with 25 µg OMVs expressing Slo or SpyCEP antigen (triangles) and with 20 µg of purified recombinant Slo or SpyCEP (squares) were serially diluted and Ig isotypes were analyzed by ELISA using plates coated with the corresponding recombinant antigens. Alkaline phosphatase-conjugated goat anti-mouse IgG, IgM, IgG1 and IgG2A were used as secondary antibodies. Graphs represent the OD values obtained for each serum dilution.
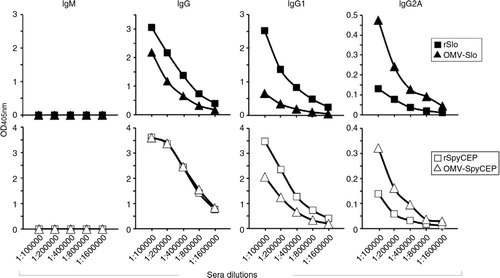
Fig. 7 Analysis of functional antibodies induced by immunization with Slo-OMVs, SpyCEP-OMVs and SAM_1372-OMVs – (a) Inhibition of IL-8 hydrolysis by sera from mice immunized with SpyCEP-OMVs. IL-8 hydrolysis was followed as described in Materials and Methods in the presence of serial dilutions of sera from mice immunized with 3 (i) or 2 (ii) doses of the different immunogens. Graphs show the percent of residual IL-8 measured after hydrolysis. Sera from each group were pooled and bars represent the geometric mean values from 3 independent experiments. (b) Inhibition of haemolytic activity of sera from mice immunized with Slo-OMVs. Haemolysis of sheep erythrocytes was measured in the presence of increasing dilutions of sera from mice immunized with the different immunogens. Haemolytic activity is expressed as percentage of OD values over the OD values obtained incubating erythrocytes with water (100% haemolysis). Sera from each group were pooled and bars represent the geometric mean values of 3 independent experiments. (c) Opsonophagocytosis activity of sera from mice immunized with SAM_1372-OMVs. OPK was carried out as described in Materials and Methods using the pools of sera from mice immunized as described in . Titers are expressed as serum dilutions resulting in 50% bacterial killing.
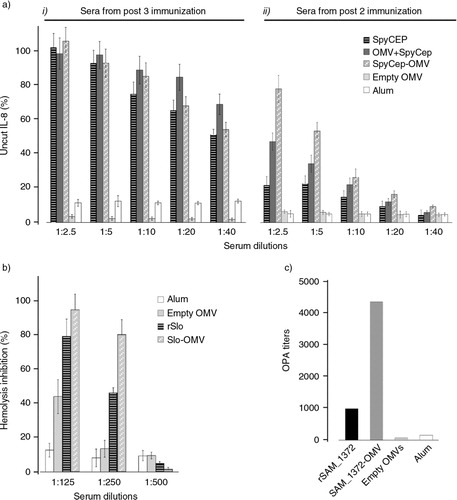
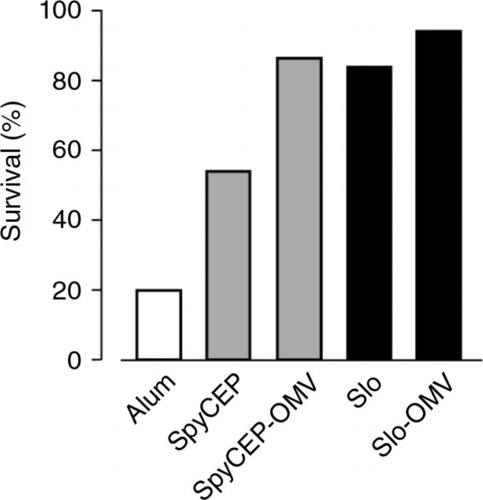
Fig. 8 In vivo protective activity of Slo-OMVs and SpyCEP-OMVs – Groups of 16 mice were immunized with 3 doses of Alum-formulated OMVs carrying heterologous antigens (25 µg total proteins), Alum-formulated purified recombinant proteins (20 µg) or Alum alone. After 2 weeks, mice were challenged intraperitoneally with a LD80 dose of M1 3348 GAS (2×10⁶ CFUs) and survival was followed over a period of 7 days.