Figures & data
Fig. 1 Efficient isolation of reference EV from breast milk by top-down density gradient ultracentrifugation. (a) Fresh human breast milk was spiked with murine ref-EV, after which EV were recovered via bottom-up or top-down density gradient ultracentrifugation. The distribution of recovered ref-EV over the different density fractions was analyzed by western blotting for murine CD9 (mCD9). Indicated are the sizes for monomeric mCD9 (*, ~23 kD), N-glycosylated monomeric mCD9 (**, ~27 kD), and high molecular weight complex mCD9 (***, ~150 kD). This result is representative of 4 independent experiments in 3 different donors. (b) Fresh human breast milk (☐) or PBS/BSA control solution (■) were spiked with murine ref-EV, after which EV were recovered via top-down density gradient ultracentrifugation. Fractions of the density gradient and the overlying milk supernatant were analyzed for the presence of mCD9 and mCD63 by western blotting. Indicated are the quantified western blot signals (mean values of 2 independent experiments in 2 different donors) normalized to the values detected in the 1.13–1.18 g/ml fractions of the PBS/BSA control (set to 100%).
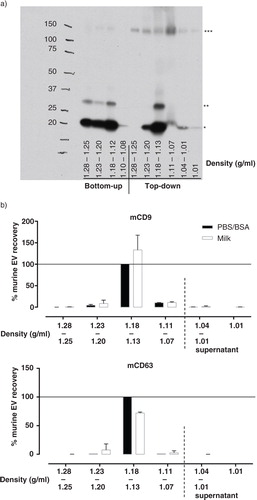
Fig. 2 Unequal distribution of native breast milk EV and major milk proteins over density gradient fractions. Fresh, unspiked human breast milk was subjected to top-down density gradient ultracentrifugation, after which the material in the different density fractions was harvested and analyzed. (a) Density fractions were pooled as indicated and analyzed for the recovery of native human breast milk EV by western blotting for human CD63 (hCD63), CD9 (hCD9), flotillin-1, and HLA class II. Results for hCD9 and HLA class II are representative of>10 independent experiments in>8 different donors; results for hCD63 and flotillin-1 represent 2 independent experiments in 2 different donors. (b, c) The protein content of individual density fractions was assessed by Coomassie blue staining (representative of 2 different donors) (b) and by western blotting for HLA class II, hCD63, hCD9, β-casein, and lactoferrin (representative of 3 different donors) (c).
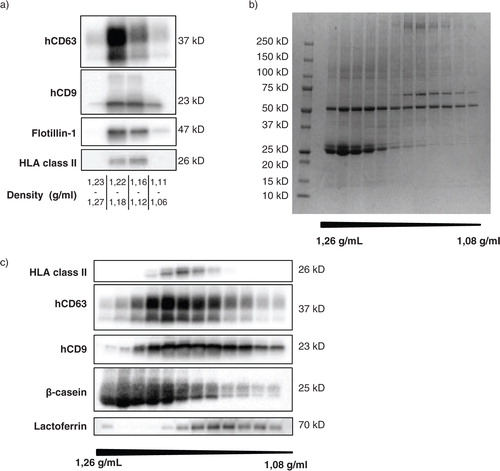
Fig. 3 Native breast milk EV are heterogeneous in size and composition. Fresh, unspiked human breast milk was subjected to top-down density gradient ultracentrifugation, after which the material from density fractions 1.12–1.18 and 1.18–1.21 g/ml was labeled with Annexin V-conjugated gold nanoparticles and analyzed by cryo-EM. (a, b, c, d) Representative and close up images of Annexin V positive and negative EV in the (a, b) 1.12–1.18 g/ml and (c, d) 1.18–1.21 g/ml density fraction. (e, f) Representative images of smooth tubular structures predominantly present in the 1.12–1.18 g/ml fraction, with (g) close up image of indicated field in (f). CF=carbon film. Data are representative of 3 independent experiments and 2 different milk donors.
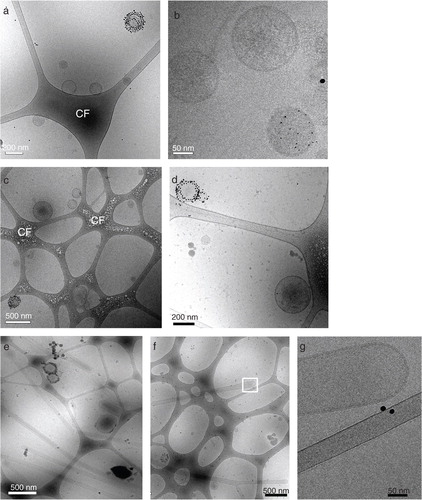
Fig. 4 Cell death in stored breast milk samples leads to contamination of the milk EV population. (a, b) Cells were isolated from fresh or stored breast milk and their viability was assessed by trypan blue exclusion. Number of viable cells determined in fresh milk samples and after storage (a) for 2 hours at −80°C (n=6 different donors) or (b) for 2 hours at 4°C (n=9 different donors). (c, d, e) Fresh breast milk was spiked with murine cells, after which cells or EV were recovered immediately or after storage at −80°C for ≥2 weeks. (c) Flow cytometric analysis of the percentage of dead murine cells in culture medium, or in fresh or stored breast milk samples. Box plots show mean±SD of 3 independent experiments in 5 donors. (d, e) EV were recovered from breast milk samples by top-down density gradient ultracentrifugation. Contamination of the breast milk EV population with vesicles induced upon sample storage was assessed by western blot detection of murine EV markers. Indicated are the quantified western blot signals for (d) mCD9 and (e) mMHC class II (mCD9 n=7; mMHC class II n=6). *p<0.05; **p<0.01.
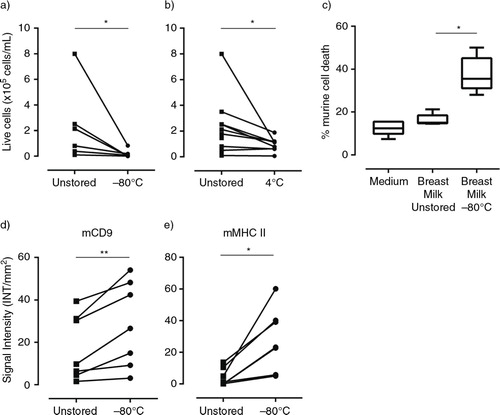
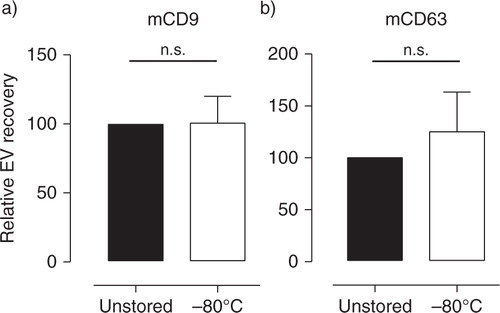
Fig. 5 Milk supernatant cleared from cells and cream can be stored for efficient and reliable recovery of EV. Fresh breast milk was spiked with murine reference EV and centrifuged twice to remove cells and cream. EV were recovered from milk supernatant before (■) and after (☐) storage at −80°C for 2–8 weeks and analyzed by western blotting for the presence of (a) mCD9 and (b) mCD63. Indicated are the quantified western blot signals (mean±SD) normalized to the values detected in unstored milk supernatant (set to 100%). mCD9 n = 5; mCD63 n = 4. n.s.=not significant.