
Figures & data
Fig. 1 Schematic overview of 4 methods to isolate exosomes from conditioned medium (CM). Approximately 3×10⁸ MCF-7 Rab27B cells were grown for 24 hours in DMEM containing 0.5% exosome-depleted serum. The CM was harvested, centrifuged, filtrated and concentrated. The concentrated conditioned medium (CCM) was equally divided over 4 isolation methods: ultracentrifugation (UC), OptiPrep™ density gradient centrifugation (ODG), ExoQuick-TC™ precipitation (EQ) and Total Exosome Isolation™ precipitation (TEI).
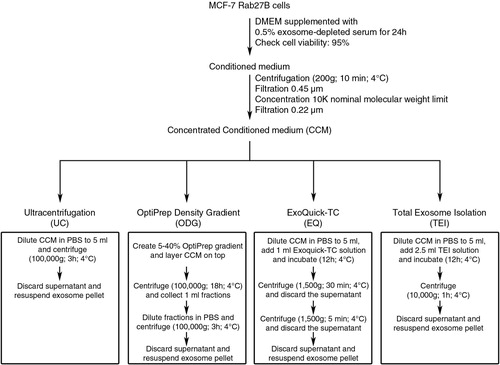
Fig. 2 Characterization of exosome preparations by Western blot. Western blot analysis of (a) common exosome markers (Alix, HSP90α, HSP70, TSG101 and CD63) and (b) cell organelle and apoptosis markers (GM130, PMP70, calreticulin and prohibitin) in 10 µg of exosomes isolated by 4 different methods. MCF-7 Rab27B total cell lysate (TCL) was loaded as positive control. Asterisks indicate loading of 50 µg of protein.
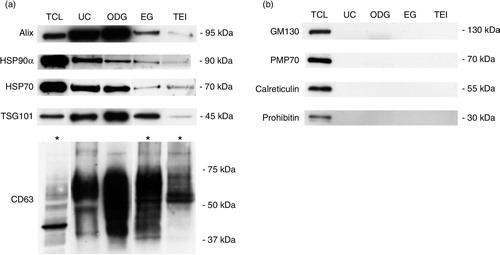
Fig. 3 Morphological characterization and quantification of exosome preparations by immunoelectron microscopy and Nanoparticle Tracking Analysis. (a) Electron micrographs of exosomes stained with 10 nm gold-conjugated anti-CD63 antibody followed by uranyl acetate counterstaining. Scale bar: 100 nm. (b) Exosome samples were analysed using Nanoparticle Tracking Analysis. The calculated size distribution is depicted as a mean (black line) with standard error (red shaded area). Total particle number, mean particle size and modus are shown for each preparation.
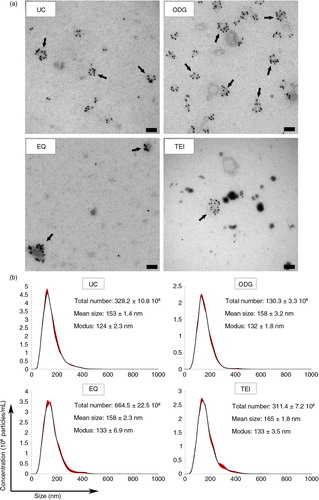
Fig. 4 Analysis of the protein content of exosome preparations. (a) Relative level of protein per 108 particles in each preparation. Error bars indicate relative standard error of two experiments. (b) Coomassie blue staining of 20 µg of MCF-7 Rab27B total cell lysate (TCL) or exosome samples separated by SDS-PAGE. (c) Number of unique peptides and corresponding percentage coverage for indicated proteins identified in MS analysis of an EQ exosome sample.
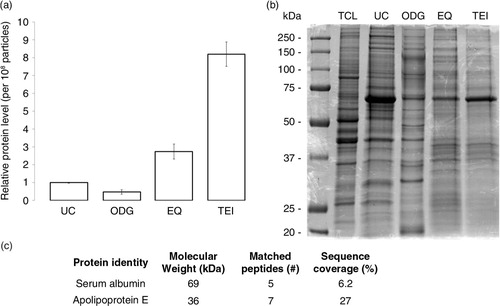
Fig. 5 Identification of the RNA content in exosome preparations. (a) Relative level of RNA per 108 particles in each preparation. Error bars indicate relative standard error of two experiments. (b) Representative electropherograms of exosome samples generated using the Experion system. Insets show RNA band pattern.
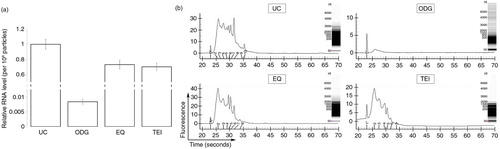
Fig. 6 Agilent microarray-based RNA profiling of exosome samples. (a) Heatmap showing unsupervised hierarchical clustering of samples. Code from blue (−2 log2 normalized expression) to red (+2 log2 normalized expression) indicates RNA expression levels. NB: Replicates 1 and 2 are technical, 3 is biological. (b) Plot showing mean expression difference and corresponding density of probes for the 3 different methods. (c) Venn diagram of unique and shared mRNAs in UC, ODG and EQ samples.
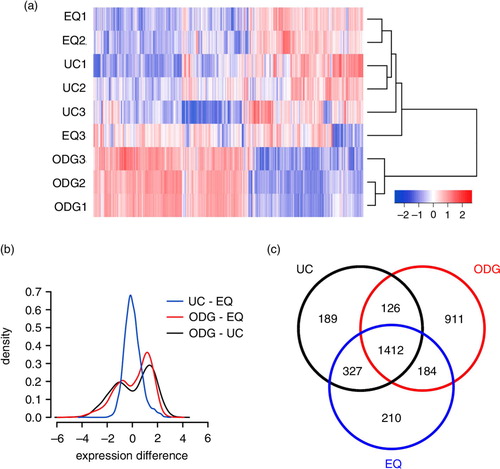
Fig. 7 Identification of enriched genes in exosome RNA samples. (a) Scatter plot showing mean RNA expression in UC versus ODG samples and indicating enriched GO terms according to DAVID analysis. (b) Gene Set Enrichment Analysis of UC versus ODG.
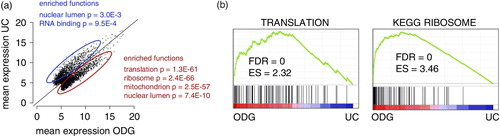
Fig. 8 RT-qPCR validation of mRNA expression. Normalized expression level of 6 genes with the lowest expression (a), and 4 genes with the highest expression (b) in ODG compared to UC and EQ according to the performed microarray. Plotted values represent 3 replicates for each method.
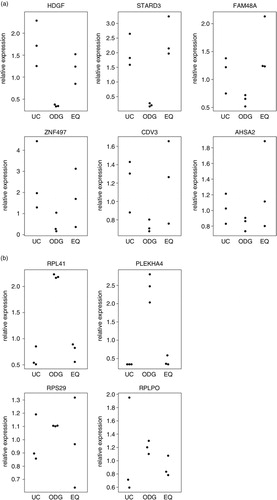
Fig. 9 Ago2 protein expression analysis. (a) Western blot results for Ago2 and TSG101 expression in each exosome preparation. (b) Individual fractions of an OptiPrep™ gradient were lysed, separated by SDS-PAGE, and tested for the presence of Ago2 and TSG101 by Western blot.
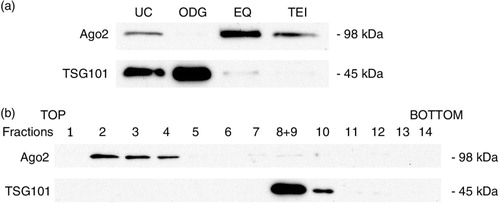
Table I Characteristics of exosome isolation methods