Figures & data
Fig. 1. Venn diagram of protein kinases detected in EVs from 3 different cell lines. All protein kinases were identified by a cross search using protein IDs of the human kinome.
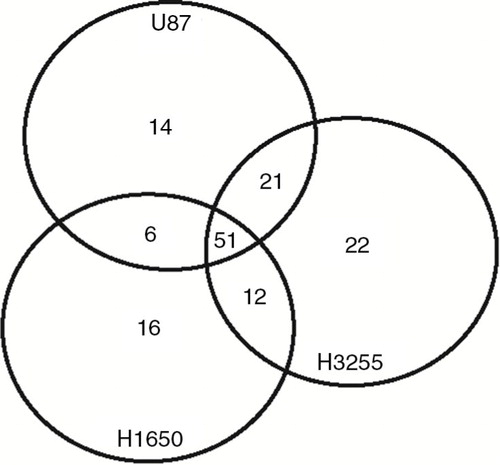
Table I. Overview of average spectral counts for the tyrosine kinases detected in extracellular vesicle samples from different cell lines
Fig. 2. U87 cells with or without overexpression of the constitutively active EGFRvIII receptor were used as model cell line. First, these cells were cultured on slides for immunostaining. Stainings were performed with EGFR and phospho-Y antibodies. (a) Sensitivity of cell lines to the EGFR inhibitor erlotinib was determined in the MTT cell viability assay. (b) Subsequently, U87 and U87-EGFRvIII cells were treated with increasing concentrations of erlotinib or DMSO vehicle. Phosphorylation of EGFR, AKT and ERK1/2 was analyzed by western blot. (c) Intensity of AKT and ERK1/2 phospho-stainings was quantified by Image J. Relative phosphorylation during erlotinib treatment is shown. (d) To assess statistical significance, the 2-tailed unpaired Student's t-test was applied. ***p≤0.001.
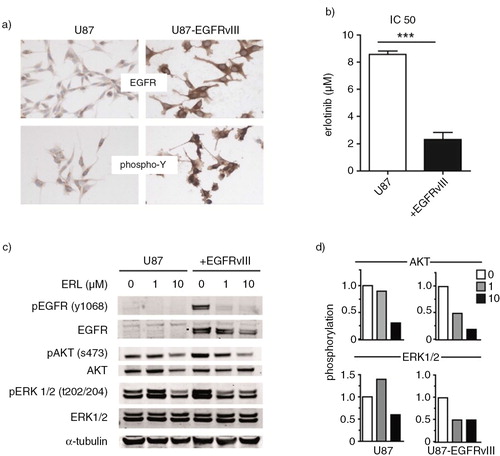
Fig. 3. EVs were isolated from U87 cells. To further characterize EVs, relative abundance of exosome markers Alix, CD63 and the apoptotic marker cytochrome-C was analyzed by western blot. (a) EV protein yield from cells with or without EGFRvIII was determined by Micro BCA protein assay. Results were normalized to cell counts as measured by hemacytometer. (b) U87 cells with or without EGFRvIII were treated with erlotinib and EVs were isolated. Phosphorylation of EGFR and downstream mediators AKT and ERK1/2 in EVs was determined by western blot. U87 cells overexpressing EGFRvIII were used as positive control for immunostaining. (c) Intensity of phosphostainings was quantified by Image J. Relative phosphorylation during treatment with erlotinib is shown. (d) To assess statistical significance, the 2-tailed unpaired Student's t-test was applied. ns=non-significant.
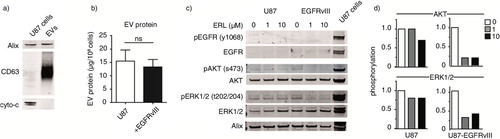
Fig. 4. EVs were isolated from culture medium of an equal number of U87 cells with or without EGFRvIII. EV pellets were treated with proteases (trypsin, 0.5 g/L) or erlotinib (10 µM) for 1 h at 37°C. Subsequently, EVs were washed in PBS and lysed. Western blot analysis was performed using equal volumes to determine protein levels and their phosphorylation. U87 cells overexpressing EGFRvIII were used as positive control for immunostaining.
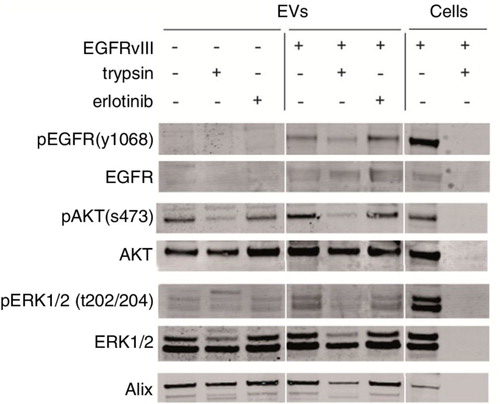
Table II. Patient characteristics
Fig. 5. Plasma was collected from 32 patients with cancer and 28 healthy donors. Total protein yield from each isolation was measured by the Micro BCA protein assay. (a–b) Phosphorylation of AKT and ERK1/2 was measured by western blot using equal protein amounts from 21 patients and 22 healthy donors. U87 cells overexpressing EGFRvIII were used as positive control for immunostaining. (c) Signal intensities were quantified by Image J imaging analysis software and phosphorylation was measured by calculating the relative signal intensity from phosphorylated and total protein levels. Subgroup analysis was performed with patients having high EV protein levels as shown in red. (a, d–e) To determine variability in total EV kinase levels in plasma, maximum protein amounts were loaded from a subgroup of patients with NSCLC. (f) Statistical significance was tested using the 2-tailed paired Student's t-test. ns=not significant, p≤0.05, **p≤0.01, ***p≤0.001.
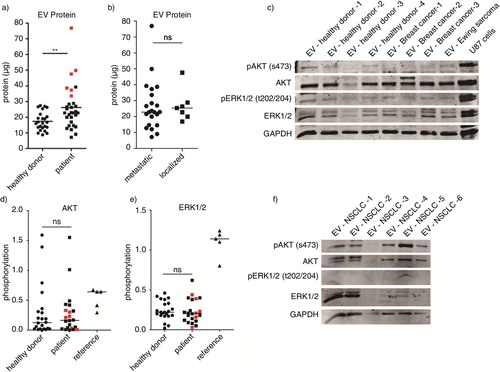
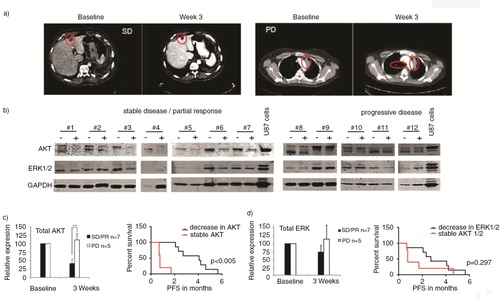
Fig. 6. Representative CT images of patient #7 at baseline and with stable disease (SD) at 3 weeks on sorafenib/metformin and of patient #9 at baseline and with progressive disease (PD) at 3 weeks on sorafenib/metformin. (a) Western blot analysis was performed of plasma EVs of NSCLC patients (n=12). (b) Total AKT and ERK1/2 levels in EVs, 3 weeks after start of treatment, are shown. Patients with PD and SD or partial response (PR) on sorafenib/metformin treatment are grouped. (b) Samples are paired pre- and on-treatment samples depicted with – and +, respectively. Signal intensities were quantified by Image J imaging analysis software. (c) Kaplan Meier curves were generated for the treatment response (PFS) of patients with stable and decreased AKT and ERK1/2 levels in EVs. (c–d) To assess statistical significance, the 2-tailed unpaired t-test was applied. *p<0.001, **p<0.0001. The log-rank test was used for statistical analysis of survival analyses.