Figures & data
Fig. 1. DotScan analysis of LIM1215 cells (b) and their EV (c). The key (a) shows antibody locations, with shaded antibodies indicating cell capture. Duplicate antibody arrays (outlined) are surrounded by a frame of alignment dots consisting of a mixture of CD44/CD29 antibodies. Detection of captured cells was by optical scanning (b). EV (7.8×10⁸ particles derived from 335 µl of LIM1215-conditioned medium) were detected by ECL using biotinylated EpCAM (CD326) antibody, with a 10 min exposure on ECL film (c). NanoSight analysis shows the size distribution of LIM1215 EV (d). The number above the peak represents mode size in nm. A Venn diagram compares surface profiles of LIM1215 cells with their EV (e). TCR, T-cell receptor; κ, λ, immunoglobulin light chains kappa, lambda; sIg, surface immunoglobulin; DCC, deleted in colorectal cancer protein; EGFR, epidermal growth factor receptor; FAP, fibroblast activation protein; HLA-ABC, HLA-DR, human leukocyte antigens A, B, C and DR, respectively; MICA, MHC class I chain-related protein A; MMP-14, matrix metallopeptidase 14; PIGR, polymeric immunoglobulin receptor; TSP-1, thrombospondin-1; Mabthera, chimeric mouse/human anti-CD20. G1, G2a, G2b and M are murine isotype control antibodies IgG1, IgG2a, IgG2b and IgM, respectively. The numbers 500, 200 and 50 refer to isotype control antibody concentrations in µg/ml. NB means no BSA in the antibody solution; these antibodies were at 500 µg/ml. Antibody details are listed in Supplementary Table 1 of Supplementary Material.
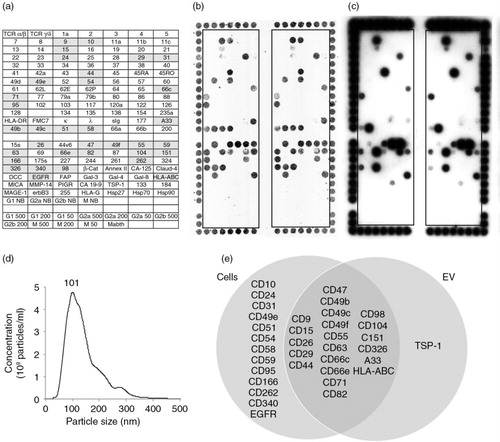
Fig. 2. DotScan profiling of MEC1 cells (b) and their EV (c). The key (a) shows locations of antibodies (as for ), with shaded antibodies indicating cell capture. Detection of captured cells was by optical scanning (b). EV (7.35×10¹⁰) were detected by ECL using biotinylated CD19 antibody, with a 5 min exposure on ECL film (c). NanoSight analysis shows the size distribution of MEC1 EV (d). A Venn diagram (e) compares surface profiles of MEC1 cells with their EV. The number above the peak represents mode size in nm.
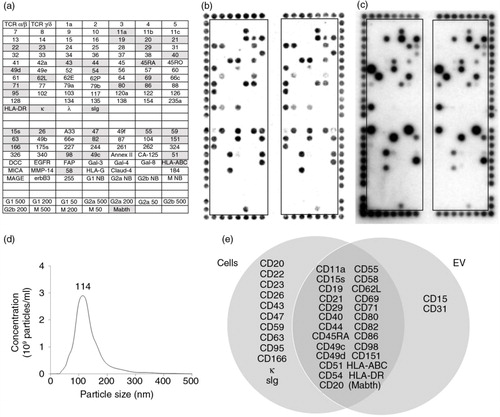
Fig. 3. Workflow for preparation of PBMC and CD61-depleted EV from blood (a), with DotScan profiling (b–d). The key (b) shows antibody locations, with shaded antibodies indicating cell capture. DotScan analyses are shown for 3×10⁶ PBMC (c) and CD61-depleted EV from 10 ml of blood (d) from an 87-year-old female CLL patient (Patient 1) with a white blood cell count of 45.3 x10⁹/L. EV were tested in the presence of heat inactivated human AB serum (2%). Detection of captured cells was by optical scanning (c). EV were detected by ECL using biotinylated CD19 antibody, with a 30 min exposure on ECL film (d). NanoSight analysis (e) compares the average size distributions (tested in triplicate) of EV in the plasma and purified CD61-depleted EV from the plasma. The results are shown as average number of particles per ml of plasma before and after enrichment for CD61-depleted EV; the numbers above the peaks represent mode sizes in nm. A Venn diagram (f) compares surface profiles of patient CLL cells and their EV.
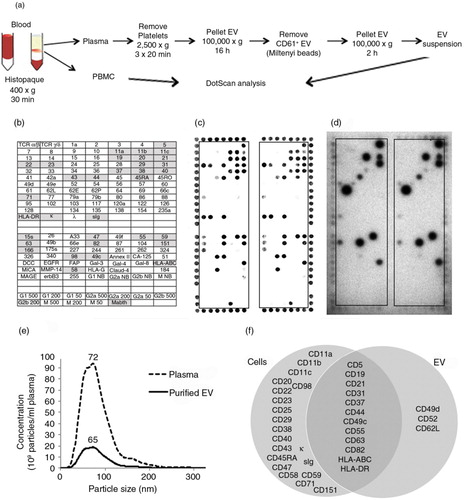
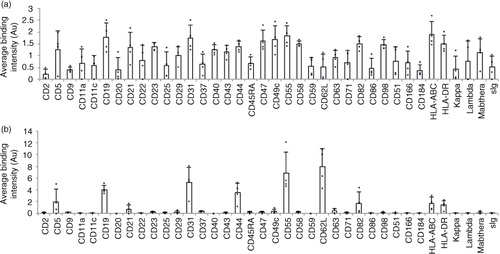
Fig. 4. Comparison of DotScan surface profiles of PBMC (3×10⁶ cells; a) and CD19+, CD61-depleted EV (b) from the blood of CLL patients (n=4). DotScan analysis was carried out as for . After background and isotype control subtraction and median centred normalization, averaged duplicate binding intensities (expressed in arbitrary units, Au) are shown for 38 antigens, each of which was detected on the cells of at least 2 of 4 CLL samples.