Figures & data
Fig. 1. Comparative characterization of prostasomes and PC3 exosomes. (a) Representative transmission electron microscopy images of PC3 exosomes and prostasomes (scale bar: 100 nm). (b) Nanoparticle tracking analysis of PC3 exosomes and prostasomes (means of 5×1 min runs, error indicate ±standard error of the mean). (c) Representative image of an colloidal blue-stained SDS-PAGE gel demonstrating the separation of proteins found in seminal prostasomes and PC3 exosomes. The values beneath the gels indicate the density of the recovered fractions from the sucrose density gradient centrifugation. (d) Western blot analysis of seminal prostasomes and PC3 exosomes probed for the indicated proteins. (e) Western blot analysis of seminal plasma-derived prostasomes from healthy individuals and prostate cancer patient plasma-derived exosomes probed for the indicated proteins. (f) Western blot analysis of seminal prostasomes and PC3 exosomes with or without treatment with proteinase K and probed for the indicated proteins.
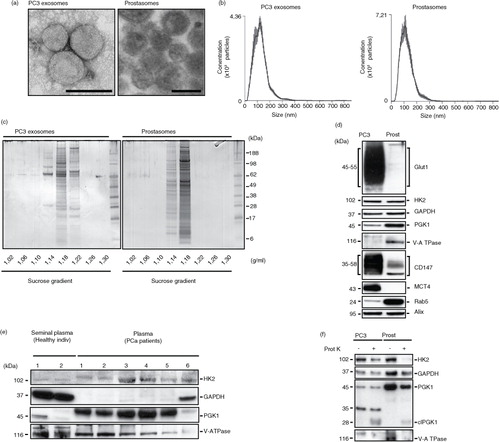
Table I. Identification of 29 common prostasomal proteins from human seminal plasma (Citation14) and PC3 cells (Citation9) subdivided in actins, annexins, CD antigens, HSP proteins, glycolytic enzymes and other proteins
Fig. 2. Glycolysis inhibition leads to decreased ATP formation by exosomes. ATP ladder (50 to 0.4 pmole) illustrating ATPase activities of prostasomes and PC3 exosomes in absence and presence of 3.3 mM vanadate (V, ATPase inhibitor) (a). Please note the minute amounts of ATP for prostasomes in absence of vanadate (V) in sharp contrast to PC3 exosomes. Estimation of ATP formation (incubation medium always containing glucose, G), in prostasomes (1 µg protein) and PC3 exosomes (1 µg protein), in (b) absence or (c) presence of glycolytic inhibitors (IA: iodoacetate; NaF: sodium fluoride) (mean values±SD, n ≥ 3).
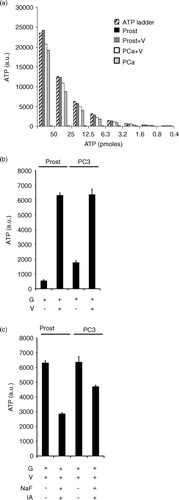
Fig. 3. EVs are taken up by prostate healthy and cancer cells. Uptake of PKH67-labelled (a) prostasomes (representing 1 µg protein) and (c) PC3 exosomes (representing 1 µg protein) by prostate epithelial CRL2221 cells and PC3 cells, illustrated by confocal microscopy after 3 h of incubation (scale bar: 5 µm). Estimation of PKH67-labelled (b) prostasomes and (d) PC3 exosomes. EV uptake (measured by flow cytometry) after 1 h, 3 h and 6 h at 37°C and results are presented as percentage of positive cells and fluorescence intensity (mean values±SEM, n = 3)
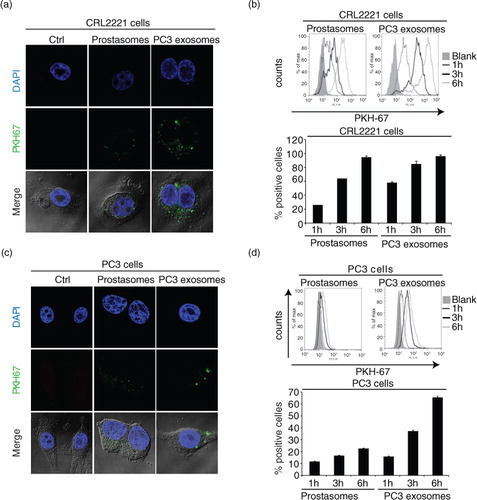
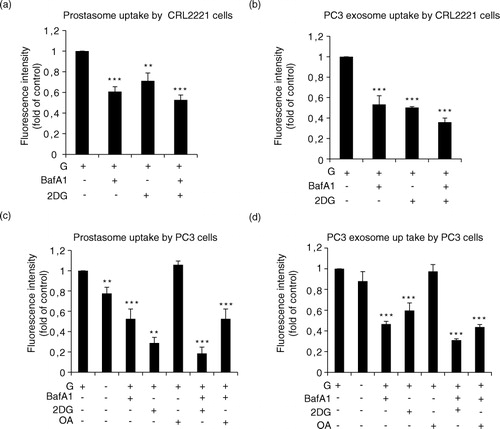
Fig. 4. Estimation of prostasome and exosome uptake by recipient cells being dependent on V-ATPase. (a) CRL2221 cells and (b) PC3 cells were incubated with PKH67-labelled prostasomes (representing 1 µg protein) or PC3 exosomes (representing 1 µg protein) in absence or presence of bafilomycin (BafA1, 10 nM), 2-deoxyglucose (2-DG, 10 mM) and/or oleic acid (OA) (100 µM) for 3 h at 37°C. Fluorescence intensity was analysed by flow cytometry. Results are expressed as a fold relationship to the control (exosomes without treatment) (mean values±SEM, n=3).